NYC Civic Data Spatial ETL Pipeline
Python, PostgreSQL, GeoPandas, AWS S3: Very deep dive
jump to… Extract Phase
jump to… Tranform Phase
jump to… Load Phase
jump to… Schema Diagram
jump to… Data Dictionary
Background / Introduction
This project demonstrates a complete Extract, Transform, and Load (ETL) data engineering pipeline. The goal is to ingest data from three distinct, real-world sources, reshape it into a clean and efficient relational model, and load it into a AWS cloud-hosted PostgreSQL database.
The final product is a query-optimized database that integrates civic service data with parking regulations and socioeconomic indicators, enabling complex analytical questions that leverage the multiple connected data sources.
Objective
The primary objective is to build a pipeline that combines:
- Event Data: 311 service requests.
- Geospatial Data: The locations and descriptions of NYC parking signs.
- Demographic Data: U.S. Census statistics at the zip code level.
This involves cleaning messy data, normalizing it into a star schema, and performing a spatial join to create an integrated dataset for analysis.
Data Sources
- NYC 311 Service Requests (2023): This dataset contains over 1.3 million service requests made to the New York City Police Department (NYPD) for the year 2023. It includes details like complaint type, location, and timestamps. A significant data transformation challenge involved web scraping coordinates for thousands of “blockface” locations that were missing latitude/longitude data.
- NYC Parking Signs: This dataset details the location and rules for approximately half a million parking regulation signs across the city. It was used to provide spatial context for the 311 service requests related to parking.
- U.S. Census ACS DP03 (2023): This dataset provides selected economic characteristics (e.g., median income, employment status) for zip codes in New York, adding socioeconomic context.
Methodology (ETL Process)
- Extract: Data was extracted from three separate CSV files hosted in a public AWS S3 bucket.
- Transform: The raw data was transformed into a clean, structured format using the
pandasandGeoPandaslibraries. - Cleaning: Dropping irrelevant columns, handling missing values, and standardizing data types (e.g., converting dates and coordinate reference systems).
- Normalization: Deconstructing the flat files into a relational schema consisting of three main tables (
service_requests,parking_signs,census_data) and 17 lookup tables (e.g.,boroughs,complaint_types,sign_types) to reduce redundancy and improve data integrity. - Integration: Performing a spatial join to find the
nearest_sign_idfor every 311 service request, linking the two primary datasets. - Load: The final, cleaned DataFrames were loaded into a PostgreSQL database hosted on AWS using the
psycopg2library, ready to be queried.
Imports / Functions
Import libraries
Relational Database Functions
EXTRACT Phase
Data Source 1: NYC311 Service Requests from 2010 to Present – NYC OpenData
NYC311 is New York City’s primary non-emergency customer service and information system, launched in 2003. It allows residents to access city services, report issues like potholes or noise, get information about city programs, and file Service Requests. You can reach NYC311 by dialing 311, using the NYC311 website or mobile app, or texting 311-NYC.
At the time of writing, the full dataset contains 41.3M rows of requests to multiple agencies (NYPD, Homeless Services, Sanitation, etc.). The arbitrary decision was made to focus on one year (2023) and all requests to NYPD, with the thought that these data could stand in for the whole dataset in a more comprehensive potential future data pipeline.
Load DataFrame csv from AWS Bucket
reqs_311_df = pd.read_csv('https://<AWS Bucket Location Redacted>.s3.us-east-2.amazonaws.com/311_Service_Requests_from_2010_to_Present_20250925.csv', low_memory=False)
display(reqs_311_df.info())Output:
Before we strip out the redundant location-related columns (leaving Latitude and Longitude), we need to decide which geospatial data to retain. We need to see what the 9000+ rows contain where lat/lon is NA.
Create DataFrame Where Latitude is Null For Inspection
missing_lat_df = reqs_311_df[reqs_311_df['Latitude'].isnull()].copy()loc_cols = ['Incident Address', 'Borough', 'Street Name', 'Cross Street 1',
'Cross Street 2', 'Intersection Street 1',
'Intersection Street 2', 'Address Type',
'X Coordinate (State Plane)', 'Y Coordinate (State Plane)']
display(missing_lat_df[loc_cols])| Incident Address | Borough | Street Name | Cross Street 1 | Cross Street 2 | Intersection Street 1 | Intersection Street 2 | Address Type | X Coordinate (State Plane) | Y Coordinate (State Plane) | |
|---|---|---|---|---|---|---|---|---|---|---|
| 226 | AVENUE H | BROOKLYN | AVENUE H | EAST 8 STREET | EAST 9 STREET | EAST 8 STREET | EAST 9 STREET | BLOCKFACE | NaN | NaN |
| 261 | NORTH ELLIOT PLACE | BROOKLYN | NORTH ELLIOT PLACE | FLUSHING AVENUE | PARK AVENUE | FLUSHING AVENUE | PARK AVENUE | BLOCKFACE | NaN | NaN |
| 273 | NORTH ELLIOT PLACE | BROOKLYN | NORTH ELLIOT PLACE | FLUSHING AVENUE | PARK AVENUE | FLUSHING AVENUE | PARK AVENUE | BLOCKFACE | NaN | NaN |
| 302 | EAST 217 STREET | BRONX | EAST 217 STREET | BRONXWOOD AVENUE | PAULDING AVENUE | BRONXWOOD AVENUE | PAULDING AVENUE | BLOCKFACE | NaN | NaN |
| 327 | 43 AVENUE | QUEENS | 43 AVENUE | 39 STREET | 39 PLACE | 39 STREET | 39 PLACE | BLOCKFACE | NaN | NaN |
| … | … | … | … | … | … | … | … | … | … | … |
| 1391595 | MAPLE STREET | BROOKLYN | MAPLE STREET | BROOKLYN AVENUE | KINGSTON AVENUE | BROOKLYN AVENUE | KINGSTON AVENUE | BLOCKFACE | NaN | NaN |
| 1391818 | EAST 5 STREET | BROOKLYN | EAST 5 STREET | DITMAS AVENUE | AVENUE F | DITMAS AVENUE | AVENUE F | BLOCKFACE | NaN | NaN |
| 1392211 | OVINGTON AVENUE | BROOKLYN | OVINGTON AVENUE | RIDGE BOULEVARD | 3 AVENUE | RIDGE BOULEVARD | 3 AVENUE | BLOCKFACE | NaN | NaN |
| 1392369 | SEGUINE AVENUE | STATEN ISLAND | SEGUINE AVENUE | MACGREGOR STREET | KNOX STREET | MACGREGOR STREET | KNOX STREET | BLOCKFACE | NaN | NaN |
| 1392458 | 7 AVENUE | BROOKLYN | 7 AVENUE | 45 STREET | 46 STREET | 45 STREET | 46 STREET | BLOCKFACE | NaN | NaN |
It looks like the majority of these have an Address Type of BLOCKFACE:
print(f'All missing lat / long rows: {missing_lat_df[loc_cols].shape[0]}')
print(f"Just 'Address Type' == BLOCKFACE rows: {missing_lat_df[missing_lat_df['Address Type'] == 'BLOCKFACE'].shape[0]}")All missing lat / long rows: 9614
Just 'Address Type' == BLOCKFACE rows: 8160
BLOCKFACE Locations Have No Coordinates
Let’s not throw away these 8000+ rows if we don’t have to. It turns out that:
A Blockface is defined as one continuous side of a physical block that is intersected on that side by two other physical through streets.
After research and trial and error, a way to obtain the single point geospatial data needed to fit in with the rest of the rows was determined:
Scrape the NYC Planning Geographic Online Address Translator website for the end points of the blockfaces and then use a calculated midpoint as the single point for the addresses.
Load Scraped Coordinates
A product of a separate process (Google Colab/Jupyter notebook), not included here.
input_url = 'https://<AWS Bucket Location Redacted>.s3.us-east-2.amazonaws.com/scraped_coords.json'

response = requests.get(input_url)
json_data = response.json()

scraped_coords = {tuple(key.split('|')): value for key, value in json_data.items()}Create scraped_coordinates_df and normalize strings:
def normalize_string(s):
    if not isinstance(s, str):
        return s
    s = s.upper()
    s = re.sub(r'\s+', ' ', s)
    s = s.strip()
    return s

key_columns = ['Borough', 'Street Name', 'Cross Street 1', 'Cross Street 2']
scraped_coords_df = pd.DataFrame.from_dict(scraped_coords, orient='index').reset_index()
scraped_coords_df.columns = key_columns + ['scraped_lat', 'scraped_lon']

for col in [key_columns]:
scraped_coords_df[col] = scraped_coords_df[col].apply(normalize_string)During the scraping process, of the 8,160 rows with BLOCKFACE and no coordinates, there were 5,499 unique rows, with 5,483 (99.7%) retrievable.
Final Scraped Coordinates
display(scraped_coords_df.info())
display(scraped_coords_df)<class 'pandas.core.frame.DataFrame'>
RangeIndex: 5483 entries, 0 to 5482
Data columns (total 6 columns):
# Column Non-Null Count Dtype
--- ------ -------------- -----
0 Borough 5483 non-null object
1 Street Name 5483 non-null object
2 Cross Street 1 5483 non-null object
3 Cross Street 2 5483 non-null object
4 scraped_lat 5483 non-null float64
5 scraped_lon 5483 non-null float64
dtypes: float64(2), object(4)
memory usage: 257.1+ KB
None
| Borough | Street Name | Cross Street 1 | Cross Street 2 | scraped_lat | scraped_lon | |
|---|---|---|---|---|---|---|
| 0 | BROOKLYN | AVENUE H | EAST 8 STREET | EAST 9 STREET | 40.629283 | -73.968466 |
| 1 | BRONX | EAST 217 STREET | BRONXWOOD AVENUE | PAULDING AVENUE | 40.879938 | -73.856584 |
| 2 | MANHATTAN | EAST 86 STREET | LEXINGTON AVENUE | 3 AVENUE | 40.779160 | -73.954785 |
| 3 | BROOKLYN | FORD STREET | BELT PARKWAY EXIT 9 EASTBOUND | EMMONS AVENUE | 40.585032 | -73.935120 |
| 4 | BROOKLYN | EAST 56 STREET | AVENUE T | AVENUE U | 40.612938 | -73.919913 |
| … | … | … | … | … | … | … |
| 5478 | QUEENS | 120 AVENUE | 180 STREET | FARMERS BOULEVARD | 40.686163 | -73.762328 |
| 5479 | BROOKLYN | SCHOLES STREET | GRAHAM AVENUE | DET BARBARA TAYLOR BURNETTE WAY | 40.708863 | -73.942600 |
| 5480 | BRONX | CORSA AVENUE | BOSTON ROAD | HICKS STREET | 40.877884 | -73.847959 |
| 5481 | QUEENS | 167 STREET | 110 AVENUE | 110 ROAD | 40.694479 | -73.785447 |
| 5482 | QUEENS | 233 STREET | 130 AVENUE | 131 AVENUE | 40.679467 | -73.734497 |
Merge Scraped Coordinates
To keep all of the original rows, we wil merge left on reqs_311_df, matching scraped_coords_df against it and filling in temporary scraped coordinate columns. We’ll use a mask to identify rows that need updating.
Integrate Scraped Coordinates:
key_columns = ['Borough', 'Street Name', 'Cross Street 1', 'Cross Street 2']
scraped_coords_df = pd.DataFrame.from_dict(scraped_coords, orient='index').reset_index()
scraped_coords_df.columns = key_columns + ['scraped_lat', 'scraped_lon']

reqs_311_df_merged = pd.merge(reqs_311_df, scraped_coords_df, on=key_columns, how='left')

mask = reqs_311_df_merged['Latitude'].isnull() & reqs_311_df_merged['scraped_lat'].notnull()

reqs_311_df_merged.loc[mask, 'Latitude'] = reqs_311_df_merged.loc[mask, 'scraped_lat']
reqs_311_df_merged.loc[mask, 'Longitude'] = reqs_311_df_merged.loc[mask, 'scraped_lon']Inspect:
display(reqs_311_df_merged.info())Drop Columns
Dropping empty columns, those that are over 98% null and/or contain redundant location data:
# Our temporary lat/lon columns
lat_lon_temp_cols = ['scraped_lat', 'scraped_lon']

# There are a number of empty columns, which we can confidently drop for this dataset,
# Should revisit if using the full 311 dataset.
empty_cols = ['Facility Type', 'Due Date', 'Taxi Company Borough', 'Taxi Pick Up Location']

# These columns contain redundant location info - we will retain only standard 'Latitude' and 'Longitude',
# 'Location' is just the lat/lon grouped.
redundant_loc_cols = ['X Coordinate (State Plane)', 'Y Coordinate (State Plane)', 'Location',
                      'Street Name', 'Cross Street 1', 'Landmark', 'Community Board', 'BBL', 'Park Borough']

# These columns are over 98% NaN. Should revisit if using the full 311 dataset.
high_nan_cols = ['Vehicle Type', 'Bridge Highway Name', 'Bridge Highway Direction', 'Road Ramp', 'Bridge Highway Segment']

drop_cols = lat_lon_temp_cols + empty_cols + redundant_loc_cols + high_nan_cols
reqs_311_df_merged.drop(columns=drop_cols, inplace=True)Final State of Data Source 1 at End of Extract Phase
display(reqs_311_df_merged.info())
display(reqs_311_df_merged.head())| Unique Key | Created Date | Closed Date | Agency | Agency Name | Complaint Type | Descriptor | Location Type | Incident Zip | Incident Address | … | Address Type | City | Status | Resolution Description | Resolution Action Updated Date | Borough | Open Data Channel Type | Park Facility Name | Latitude | Longitude | |
|---|---|---|---|---|---|---|---|---|---|---|---|---|---|---|---|---|---|---|---|---|---|
| 0 | 59889383 | 12/31/2023 11:59:42 PM | 01/01/2024 01:51:01 AM | NYPD | New York City Police Department | Noise - Street/Sidewalk | Loud Music/Party | Street/Sidewalk | 11375.0 | 63-10 108 STREET | … | ADDRESS | FOREST HILLS | Closed | The Police Department responded to tde complai… | 01/01/2024 01:51:05 AM | QUEENS | MOBILE | Unspecified | 40.734695 | -73.850521 |
| 1 | 59893860 | 12/31/2023 11:59:29 PM | 01/01/2024 01:51:32 AM | NYPD | New York City Police Department | Noise - Street/Sidewalk | Loud Music/Party | Street/Sidewalk | 11374.0 | 65-09 99 STREET | … | ADDRESS | REGO PARK | Closed | The Police Department responded to tde complai… | 01/01/2024 01:51:35 AM | QUEENS | MOBILE | Unspecified | 40.729379 | -73.855433 |
| 2 | 59892892 | 12/31/2023 11:59:29 PM | 01/01/2024 04:06:24 AM | NYPD | New York City Police Department | Blocked Driveway | Partial Access | Street/Sidewalk | 11355.0 | 143-34 BARCLAY AVENUE | … | ADDRESS | FLUSHING | Closed | The Police Department responded to tde complai… | 01/01/2024 04:06:28 AM | QUEENS | MOBILE | Unspecified | 40.759286 | -73.822614 |
| 3 | 59887231 | 12/31/2023 11:59:23 PM | 01/01/2024 12:13:30 AM | NYPD | New York City Police Department | Noise - Street/Sidewalk | Loud Music/Party | Street/Sidewalk | 11232.0 | 870 42 STREET | … | ADDRESS | BROOKLYN | Closed | The Police Department responded to tde complai… | 01/01/2024 12:13:33 AM | BROOKLYN | MOBILE | Unspecified | 40.644725 | -73.997622 |
| 4 | 59893808 | 12/31/2023 11:59:18 PM | 01/01/2024 02:08:19 AM | NYPD | New York City Police Department | Illegal Parking | Blocked Hydrant | Street/Sidewalk | 11228.0 | 8842 7 AVENUE | … | ADDRESS | BROOKLYN | Closed | The Police Department responded to tde complai… | 01/01/2024 02:08:22 AM | BROOKLYN | MOBILE | Unspecified | 40.616951 | -74.021857 |
Data Source 2: NYC Parking Regulations - City of New York
From the URL:
Department of Transportation manages approximately 1,000,000 signs on the streets of New York. This dataset contains current and historical (see note below) parking regulation signs. For all street signs, please use https://data.cityofnewyork.us/Transportation/Street-Sign-Work-Orders/qt6m-xctn
Load DataFrame csv from AWS Bucket
parking_df = pd.read_csv("https://<AWS Bucket Location Redacted>.s3.us-east-2.amazonaws.com/Parking_Regulation_Locations_and_Signs_20251001.csv")
display(parking_df.info())
display(parking_df.head())| order_number | record_type | order_type | borough | on_street | on_street_suffix | from_street | from_street_suffix | to_street | to_street_suffix | … | sign_design_voided_on_date | sign_location | distance_from_intersection | arrow_direction | facing_direction | sheeting_type | support | sign_notes | sign_x_coord | sign_y_coord | |
|---|---|---|---|---|---|---|---|---|---|---|---|---|---|---|---|---|---|---|---|---|---|
| 0 | S-01656183 | Current | S- | Brooklyn | HENDRIX STREET | NaN | NEW LOTS AVENUE | NaN | HEGEMAN AVENUE | NaN | … | NaN | NaN | 487 | Soutd | NaN | PNTD | DR | NaN | 1015753.0 | 180907.0 |
| 1 | P-01667780 | Current | P- | Manhattan | 3 AVENUE | NaN | EAST 85 STREET | NaN | EAST 86 STREET | NaN | … | NaN | NaN | 44 | NaN | NaN | PNTD | SAME | NaN | 996877.0 | 222815.0 |
| 2 | S-01665760 | Current | S- | Bronx | EAST 217 STREET | NaN | WHITE PLAINS ROAD | NaN | BARNES AVENUE | NaN | … | NaN | NaN | 146 | West | NaN | PNTD | DR | NaN | 1022145.0 | 260647.0 |
| 3 | P-01667780 | Current | P- | Manhattan | 3 AVENUE | NaN | EAST 85 STREET | NaN | EAST 86 STREET | NaN | … | NaN | NaN | 44 | NaN | NaN | PNTD | SAME | NaN | 996877.0 | 222815.0 |
| 4 | P-01748163 | Current | P- | Queens | NORTHERN BOULEVARD | NaN | BROWVALE LANE | NaN | LITTLE NECK PARKWAY | NaN | … | NaN | NaN | 101 | NaN | NaN | PNTD | SAME | N20G | 1057386.0 | 219889.0 |
Drop Columns
We’ll drop sign_location, which is mostly null and gives the location of a sign relative to an intersection by way of a code. We have the location coordinates, so this is unneeded. record_type is always ‘Current’ and therefore can also be removed.
The remaining dropped columns refer to installation details that seem to be left over from when the entry was used to create or fill in work orders, and are unnecessary as well.
# DROPS

# Empty or over 98% NaN
high_nan_cols_2 = ['sign_location', 'sign_design_voided_on_date']

# All others
unneeded_cols = ['order_number', 'record_type', 'order_type', 'order_completed_on_date',
                 'sheeting_type', 'support', 'sign_notes']

drop_cols_2 = high_nan_cols_2 + unneeded_cols
parking_df.drop(columns=drop_cols_2, inplace=True)DataFrame after the column drops:
display(parking_df.info())<class 'pandas.core.frame.DataFrame'>
RangeIndex: 439619 entries, 0 to 439618
Data columns (total 16 columns):
# Column Non-Null Count Dtype
--- ------ -------------- -----
0 borough 439619 non-null object
1 on_street 439619 non-null object
2 on_street_suffix 12775 non-null object
3 from_street 439619 non-null object
4 from_street_suffix 3127 non-null object
5 to_street 439619 non-null object
6 to_street_suffix 3354 non-null object
7 side_of_street 439619 non-null object
8 sign_code 439619 non-null object
9 sign_description 439619 non-null object
10 sign_size 438126 non-null object
11 distance_from_intersection 439619 non-null int64
12 arrow_direction 106487 non-null object
13 facing_direction 2197 non-null object
14 sign_x_coord 404140 non-null float64
15 sign_y_coord 404140 non-null float64
dtypes: float64(2), int64(1), object(13)
memory usage: 53.7+ MB
None
There are 439,619 rows in the dataset, but only 404,140 of them have x, y coordinates. Let’s inspect:
missing_x_df = parking_df[parking_df['sign_x_coord'].isnull()].copy()

display(missing_x_df.info())
display(missing_x_df)| borough | on_street | on_street_suffix | from_street | from_street_suffix | to_street | to_street_suffix | side_of_street | sign_code | sign_description | sign_size | distance_from_intersection | arrow_direction | facing_direction | sign_x_coord | sign_y_coord | |
|---|---|---|---|---|---|---|---|---|---|---|---|---|---|---|---|---|
| 65 | Bronx | WILLIAMSBRIDGE ROAD | NaN | SACKETT AVENUE | NaN | POPLAR STREET | NaN | W | PS-229B | NO PARKING (SANITATION BROOM SYMBOL) WEDNESDAY… | 018 X 012 | 273 | NaN | NaN | NaN | NaN |
| 130 | Queens | CROSS BAY BOULEVARD | NaN | EAST 1 ROAD | NaN | ADDABBO BRIDGE PARKING AREA | NaN | E | SI-1910G | SELECT BUS SERVICE ROUTE PANEL (TEXT TO BE MOD… | 14.12 X 6 | 1192 | NaN | NaN | NaN | NaN |
| 159 | Staten Island | AMBOY ROAD | NaN | SHARROTT AVENUE | NaN | WOODVALE AVENUE | NaN | S | PS-2G | NO PARKING ANYTIME <-> (SUPERSEDES SP-854C) | 018 X 012 | 614 | NaN | NaN | NaN | NaN |
| 182 | Bronx | HALLECK STREET | NaN | OAK POINT AVENUE | NaN | HUNTS POINT AVENUE | NaN | W | SI-584G | 14 STREET & UNION SQ (BOTTOM LOCATION PANEL)(U… | 016 X 008 | 474 | NaN | NaN | NaN | NaN |
| 191 | Queens | OCEANIA STREET | NaN | 58 AVENUE | NaN | HORACE HARDING EXPRESSWAY *N S/R | NaN | W | PS-3G | NO STOPPING ANYTIME <-> (SUPERSEDES SP-14A) | 018 X 012 | 260 | NaN | NaN | NaN | NaN |
| … | … | … | … | … | … | … | … | … | … | … | … | … | … | … | … | … |
| 439607 | Queens | AMBOY LANE | NaN | AMBOY LANE | W | SPRINGFIELD BOULEVARD | NaN | S | SP-477B | BUS STOP SIGN (BUS & HANDICAP SYMBOLS) NO STAN… | 020 DIAMETER | 212 | NaN | NaN | NaN | NaN |
| 439610 | Queens | YELLOWSTONE BOULEVARD | NaN | QUEENS BOULEVARD | NaN | AUSTIN STREET | NaN | W | PS-38BA | NO PARKING (SANITATION BROOM SYMBOL) TUESDAY 1… | 018 X 012 | 775 | Nortd | NaN | NaN | NaN |
| 439612 | Queens | YELLOWSTONE BOULEVARD | NaN | QUEENS BOULEVARD | NaN | AUSTIN STREET | NaN | W | PS-38B | NO PARKING (SANITATION BROOM SYMBOL) TUESDAY 1… | 018 X 012 | 620 | NaN | NaN | NaN | NaN |
| 439615 | Queens | YELLOWSTONE BOULEVARD | NaN | QUEENS BOULEVARD | NaN | AUSTIN STREET | NaN | W | PS-38BA | NO PARKING (SANITATION BROOM SYMBOL) TUESDAY 1… | 018 X 012 | 392 | Nortd | NaN | NaN | NaN |
| 439617 | Bronx | HUTCHINSON RIVER PARKWAY EAST | NaN | EINSTEIN LOOP SOUTH | NaN | EINSTEIN LOOP NORTH | NaN | E | PS-1GA | NO STANDING ANYTIME –> (SUPERSEDES SP-1044BA,… | 018 X 012 | 308 | Nortd | NaN | NaN | NaN |
Inspecting a row in detail:
row_55 = missing_x_df.iloc[54]
for col, value in row_55.items():
print(f'{col}: {value}')borough: Bronx
on_street: MARBLE HILL AVENUE
on_street_suffix: nan
from_street: WEST 225 STREET
from_street_suffix: nan
to_street: WEST 228 STREET
to_street_suffix: nan
side_of_street: E
sign_code: PS-2GA
sign_description: NO PARKING ANYTIME --> (SUPERSEDES SP-854CA)
sign_size: 018 X 012
distance_from_intersection: 1071
arrow_direction: North
facing_direction: nan
sign_x_coord: nan
sign_y_coord: nan
35,000+ rows with no x, y coordinates
We could use the same scraping method of imputation with on_street, from_street, and to_street as in Data Source 1 with some minor adjustments, BUT! the process is extremely time consuming, even the ~5,500 rows we worked with in that dataset took over 7 hours to process.
We will have to leave this task for future improvement.
To that end, we will drop those rows and convert the coordinates that are present to lat/lon.
Coordinate Conversion
Currently, the coordinates sign_x_coord and sign_y_coord are in the following Coordinate Reference System (CRS):
NAD_1983_StatePlane_New_York_Long_Island_FIPS_3104_Feet, Projection: Lambert_Conformal_Conic, EPSG:2263
We will convert to standard Latitude/Longitude (EPSG:4326) using the Python GeoPandas library.
# Coordinate conversion
parking_with_coords = parking_df[parking_df['sign_x_coord'].notna()].copy()

gdf = gpd.GeoDataFrame(parking_with_coords,
                       geometry=gpd.points_from_xy(parking_with_coords.sign_x_coord,
                                                   parking_with_coords.sign_y_coord),
                       crs='EPSG:2263')

gdf = gdf.to_crs('EPSG:4326')

gdf['latitude'] = gdf.geometry.y
gdf['longitude'] = gdf.geometry.x

parking_df = parking_df.join(gdf[['latitude', 'longitude']])

# Let's go ahead and drop the x, y coord columns
parking_df.drop(columns=['sign_x_coord', 'sign_y_coord'], inplace=True)Inspect a row:
row_555 = parking_df.iloc[554]
for col, value in row_555.items():
print(f'{col}: {value}')borough: Queens
on_street: 78 STREET
on_street_suffix: nan
from_street: 37 AVENUE
from_street_suffix: nan
to_street: ROOSEVELT AVENUE
to_street_suffix: nan
side_of_street: W
sign_code: PS-30B
sign_description: NO PARKING (SANITATION BROOM SYMBOL) THURSDAY 8:30AM-10AM <-> (SUPERSEDES SP-461C)
sign_size: 018 X 012
distance_from_intersection: 609
arrow_direction: nan
facing_direction: nan
latitude: 40.74764553807598
longitude: -73.88777353216086
Drop the rows with no lat/lon:
parking_df.dropna(subset=['latitude'], inplace=True)
parking_df.reset_index(drop=True, inplace=True)Final State of Data Source 2 at End of Extract Phase
display(parking_df.info())<class 'pandas.core.frame.DataFrame'>
RangeIndex: 404140 entries, 0 to 404139
Data columns (total 16 columns):
# Column Non-Null Count Dtype
--- ------ -------------- -----
0 borough 404140 non-null object
1 on_street 404140 non-null object
2 on_street_suffix 9116 non-null object
3 from_street 404140 non-null object
4 from_street_suffix 1586 non-null object
5 to_street 404140 non-null object
6 to_street_suffix 1731 non-null object
7 side_of_street 404140 non-null object
8 sign_code 404140 non-null object
9 sign_description 404140 non-null object
10 sign_size 403397 non-null object
11 distance_from_intersection 404140 non-null int64
12 arrow_direction 97358 non-null object
13 facing_direction 1329 non-null object
14 latitude 404140 non-null float64
15 longitude 404140 non-null float64
dtypes: float64(2), int64(1), object(13)
memory usage: 49.3+ MB
None
Data Source 3: US Census Bureau ACS DP03 Selected Economic Characteristics
The ACS DP03 Selected Economic Characteristics table provides data on employment status, class of worker, income, and benefits from the American Community Survey (ACS). This table contains information on topics like the labor force, industry and occupation, and various types of household income.
This data source was downloaded after aggregating by the relevant Zip Code Tabulation Area, limiting the data to the year 2023.
FINAL DATAFRAME (Before Transform Stage): census_df
COLUMN METADATA DF: dp03_col_metadata_df
Load DataFrame csv from AWS Bucket
census_dp03_df = pd.read_csv('https://<AWS Bucket Location Redacted>.s3.us-east-2.amazonaws.com/ACSDP5Y2023.DP03-Data.csv', low_memory=False)
display(census_dp03_df.info())
display(census_dp03_df)<class 'pandas.core.frame.DataFrame'>
RangeIndex: 1825 entries, 0 to 1824
Columns: 551 entries, GEO_ID to Unnamed: 550
dtypes: float64(1), object(550)
memory usage: 7.7+ MB
None
| GEO_ID | NAME | DP03_0001E | DP03_0001M | DP03_0002E | DP03_0002M | DP03_0003E | DP03_0003M | DP03_0004E | DP03_0004M | … | DP03_0133PM | DP03_0134PE | DP03_0134PM | DP03_0135PE | DP03_0135PM | DP03_0136PE | DP03_0136PM | DP03_0137PE | DP03_0137PM | Unnamed: 550 | |
|---|---|---|---|---|---|---|---|---|---|---|---|---|---|---|---|---|---|---|---|---|---|
| 0 | Geography | Geographic Area Name | Estimate!!EMPLOYMENT STATUS!!Population 16 yea… | Margin of Error!!EMPLOYMENT STATUS!!Population… | Estimate!!EMPLOYMENT STATUS!!Population 16 yea… | Margin of Error!!EMPLOYMENT STATUS!!Population… | Estimate!!EMPLOYMENT STATUS!!Population 16 yea… | Margin of Error!!EMPLOYMENT STATUS!!Population… | Estimate!!EMPLOYMENT STATUS!!Population 16 yea… | Margin of Error!!EMPLOYMENT STATUS!!Population… | … | Percent Margin of Error!!PERCENTAGE OF FAMILIE… | Percent!!PERCENTAGE OF FAMILIES AND PEOPLE WHO… | Percent Margin of Error!!PERCENTAGE OF FAMILIE… | Percent!!PERCENTAGE OF FAMILIES AND PEOPLE WHO… | Percent Margin of Error!!PERCENTAGE OF FAMILIE… | Percent!!PERCENTAGE OF FAMILIES AND PEOPLE WHO… | Percent Margin of Error!!PERCENTAGE OF FAMILIE… | Percent!!PERCENTAGE OF FAMILIES AND PEOPLE WHO… | Percent Margin of Error!!PERCENTAGE OF FAMILIE… | NaN |
| 1 | 860Z200US06390 | ZCTA5 06390 | 45 | 30 | 33 | 27 | 33 | 27 | 30 | 26 | … | 49.0 | 0.0 | 49.0 | - | ** | 0.0 | 64.5 | 0.0 | 63.3 | NaN |
| 2 | 860Z200US10001 | ZCTA5 10001 | 25900 | 1482 | 19082 | 1388 | 19082 | 1388 | 17926 | 1407 | … | 2.3 | 14.1 | 2.2 | 16.6 | 6.5 | 13.7 | 5.2 | 17.1 | 3.0 | NaN |
| 3 | 860Z200US10002 | ZCTA5 10002 | 66419 | 2595 | 37021 | 1896 | 36991 | 1907 | 33913 | 1864 | … | 2.5 | 20.1 | 2.8 | 31.1 | 4.8 | 22.3 | 4.2 | 29.9 | 3.2 | NaN |
| 4 | 860Z200US10003 | ZCTA5 10003 | 50449 | 2599 | 33983 | 2226 | 33976 | 2226 | 32313 | 2211 | … | 2.4 | 12.8 | 2.7 | 16.8 | 4.8 | 2.8 | 1.8 | 19.4 | 3.5 | NaN |
| … | … | … | … | … | … | … | … | … | … | … | … | … | … | … | … | … | … | … | … | … | … |
| 1820 | 860Z200US14898 | ZCTA5 14898 | 1194 | 186 | 651 | 143 | 651 | 143 | 596 | 110 | … | 2.9 | 6.6 | 3.6 | 6.6 | 4.6 | 9.5 | 7.8 | 16.0 | 6.8 | NaN |
| 1821 | 860Z200US14901 | ZCTA5 14901 | 11637 | 719 | 5181 | 543 | 5181 | 543 | 4831 | 546 | … | 4.4 | 28.2 | 5.1 | 18.0 | 5.6 | 23.7 | 7.0 | 38.3 | 6.5 | NaN |
| 1822 | 860Z200US14903 | ZCTA5 14903 | 6015 | 572 | 3689 | 488 | 3640 | 495 | 3457 | 492 | … | 4.7 | 15.3 | 5.2 | 21.0 | 8.9 | 18.9 | 7.5 | 21.6 | 6.2 | NaN |
| 1823 | 860Z200US14904 | ZCTA5 14904 | 11593 | 662 | 7449 | 571 | 7449 | 571 | 6666 | 527 | … | 3.1 | 19.2 | 3.5 | 12.8 | 5.7 | 17.4 | 5.4 | 28.6 | 5.7 | NaN |
| 1824 | 860Z200US14905 | ZCTA5 14905 | 7214 | 602 | 4798 | 560 | 4798 | 560 | 4499 | 517 | … | 4.4 | 13.7 | 4.7 | 10.2 | 6.1 | 11.4 | 4.8 | 25.0 | 8.0 | NaN |
Drop Columns
The dataset has a large number of columns (551) - useful for statistical analysis - but to keep our database focused and manageable we are going to drop certain categories of columns. The column names are coded to indicate what measure they contain, as follows (numbers are illustrative):
- DP03_0001E: Estimated value
- DP03 0001M: Margin of error for the value
- DP03_0002P: Value in percent
- DP03_0002PM: Margin of error for the percentage
We are going to drop all “M” and “PM” columns as we only need the raw values.
# Drop all "M" and "PM" columns
all_dp03_cols = census_dp03_df.columns.tolist()
drop_cols_3 = [col for col in all_dp03_cols if col.endswith('M') or col.endswith('PM')]

# Drop "Unnamed: 550" column too
drop_cols_3.append('Unnamed: 550')

keep_cols_3 = [col for col in all_dp03_cols if col not in drop_cols_3]

census_df = census_dp03_df[keep_cols_3].copy()Final State of Data Source 3 at End of Extract Phase
display(census_df.info())
display(census_df)<class 'pandas.core.frame.DataFrame'>
RangeIndex: 1825 entries, 0 to 1824
Columns: 276 entries, GEO_ID to DP03_0137PE
dtypes: object(276)
memory usage: 3.8+ MB
None
| GEO_ID | NAME | DP03_0001E | DP03_0002E | DP03_0003E | DP03_0004E | DP03_0005E | DP03_0006E | DP03_0007E | DP03_0008E | … | DP03_0128PE | DP03_0129PE | DP03_0130PE | DP03_0131PE | DP03_0132PE | DP03_0133PE | DP03_0134PE | DP03_0135PE | DP03_0136PE | DP03_0137PE | |
|---|---|---|---|---|---|---|---|---|---|---|---|---|---|---|---|---|---|---|---|---|---|
| 0 | Geography | Geographic Area Name | Estimate!!EMPLOYMENT STATUS!!Population 16 yea… | Estimate!!EMPLOYMENT STATUS!!Population 16 yea… | Estimate!!EMPLOYMENT STATUS!!Population 16 yea… | Estimate!!EMPLOYMENT STATUS!!Population 16 yea… | Estimate!!EMPLOYMENT STATUS!!Population 16 yea… | Estimate!!EMPLOYMENT STATUS!!Population 16 yea… | Estimate!!EMPLOYMENT STATUS!!Population 16 yea… | Estimate!!EMPLOYMENT STATUS!!Civilian labor force | … | Percent!!PERCENTAGE OF FAMILIES AND PEOPLE WHO… | Percent!!PERCENTAGE OF FAMILIES AND PEOPLE WHO… | Percent!!PERCENTAGE OF FAMILIES AND PEOPLE WHO… | Percent!!PERCENTAGE OF FAMILIES AND PEOPLE WHO… | Percent!!PERCENTAGE OF FAMILIES AND PEOPLE WHO… | Percent!!PERCENTAGE OF FAMILIES AND PEOPLE WHO… | Percent!!PERCENTAGE OF FAMILIES AND PEOPLE WHO… | Percent!!PERCENTAGE OF FAMILIES AND PEOPLE WHO… | Percent!!PERCENTAGE OF FAMILIES AND PEOPLE WHO… | Percent!!PERCENTAGE OF FAMILIES AND PEOPLE WHO… |
| 1 | 860Z200US06390 | ZCTA5 06390 | 45 | 33 | 33 | 30 | 3 | 0 | 12 | 33 | … | 0.0 | 0.0 | 0.0 | - | 0.0 | 0.0 | 0.0 | - | 0.0 | 0.0 |
| 2 | 860Z200US10001 | ZCTA5 10001 | 25900 | 19082 | 19082 | 17926 | 1156 | 0 | 6818 | 19082 | … | 15.5 | 23.7 | 23.4 | 0.0 | 36.5 | 14.4 | 14.1 | 16.6 | 13.7 | 17.1 |
| 3 | 860Z200US10002 | ZCTA5 10002 | 66419 | 37021 | 36991 | 33913 | 3078 | 30 | 29398 | 36991 | … | 24.9 | 37.1 | 37.1 | 30.8 | 38.9 | 23.0 | 20.1 | 31.1 | 22.3 | 29.9 |
| 4 | 860Z200US10003 | ZCTA5 10003 | 50449 | 33983 | 33976 | 32313 | 1663 | 7 | 16466 | 33976 | … | 12.7 | 1.2 | 1.1 | 0.0 | 1.8 | 13.6 | 12.8 | 16.8 | 2.8 | 19.4 |
| … | … | … | … | … | … | … | … | … | … | … | … | … | … | … | … | … | … | … | … | … | … |
| 1820 | 860Z200US14898 | ZCTA5 14898 | 1194 | 651 | 651 | 596 | 55 | 0 | 543 | 651 | … | 10.3 | 22.4 | 20.9 | 8.5 | 28.2 | 6.6 | 6.6 | 6.6 | 9.5 | 16.0 |
| 1821 | 860Z200US14901 | ZCTA5 14901 | 11637 | 5181 | 5181 | 4831 | 350 | 0 | 6456 | 5181 | … | 28.0 | 34.9 | 34.9 | 26.6 | 36.9 | 25.7 | 28.2 | 18.0 | 23.7 | 38.3 |
| 1822 | 860Z200US14903 | ZCTA5 14903 | 6015 | 3689 | 3640 | 3457 | 183 | 49 | 2326 | 3640 | … | 19.6 | 32.3 | 31.3 | 66.0 | 15.4 | 16.5 | 15.3 | 21.0 | 18.9 | 21.6 |
| 1823 | 860Z200US14904 | ZCTA5 14904 | 11593 | 7449 | 7449 | 6666 | 783 | 0 | 4144 | 7449 | … | 20.8 | 32.8 | 32.8 | 43.9 | 30.0 | 17.7 | 19.2 | 12.8 | 17.4 | 28.6 |
| 1824 | 860Z200US14905 | ZCTA5 14905 | 7214 | 4798 | 4798 | 4499 | 299 | 0 | 2416 | 4798 | … | 14.3 | 19.6 | 19.3 | 25.8 | 17.2 | 12.8 | 13.7 | 10.2 | 11.4 | 25.0 |
DP03 Column Metadata
Contains the column names from Data Source 3 and the description of the data for each.
We will use this to create a lookup table for the column names in the final table.
Load DP03 column metadata from AWS csv:
dp03_col_metadata_df = pd.read_csv('https://<AWS Bucket Location Redacted>.s3.us-east-2.amazonaws.com/ACSDP5Y2023.DP03-Column-Metadata.csv')
display(dp03_col_metadata_df.info())
display(dp03_col_metadata_df)<class 'pandas.core.frame.DataFrame'>
RangeIndex: 550 entries, 0 to 549
Data columns (total 2 columns):
# Column Non-Null Count Dtype
--- ------ -------------- -----
0 Column Name 550 non-null object
1 Label 550 non-null object
dtypes: object(2)
memory usage: 8.7+ KB
None
| Column Name | Label | |
|---|---|---|
| 0 | GEO_ID | Geography |
| 1 | NAME | Geographic Area Name |
| 2 | DP03_0001E | Estimate!!EMPLOYMENT STATUS!!Population 16 yea… |
| 3 | DP03_0001M | Margin of Error!!EMPLOYMENT STATUS!!Population… |
| 4 | DP03_0002E | Estimate!!EMPLOYMENT STATUS!!Population 16 yea… |
| … | … | … |
| 545 | DP03_0135PM | Percent Margin of Error!!PERCENTAGE OF FAMILIE… |
| 546 | DP03_0136PE | Percent!!PERCENTAGE OF FAMILIES AND PEOPLE WHO… |
| 547 | DP03_0136PM | Percent Margin of Error!!PERCENTAGE OF FAMILIE… |
| 548 | DP03_0137PE | Percent!!PERCENTAGE OF FAMILIES AND PEOPLE WHO… |
| 549 | DP03_0137PM | Percent Margin of Error!!PERCENTAGE OF FAMILIE… |
Drop the rows that correspond to the dropped columns from Data Source 3:
all_but_2_metadata_rows = dp03_col_metadata_df.loc[2:, 'Column Name'].tolist()
rows_to_drop = [row for row in all_but_2_metadata_rows if row.endswith('M') or row.endswith('PM')]
row_mask = ~dp03_col_metadata_df['Column Name'].isin(rows_to_drop)
col_metadata_df = dp03_col_metadata_df[row_mask]
dp03_col_metadata_df = col_metadata_df.reset_index(drop=True)Check the drop result:
display(dp03_col_metadata_df.info())
display(dp03_col_metadata_df)<class 'pandas.core.frame.DataFrame'>
RangeIndex: 276 entries, 0 to 275
Data columns (total 2 columns):
# Column Non-Null Count Dtype
--- ------ -------------- -----
0 Column Name 276 non-null object
1 Label 276 non-null object
dtypes: object(2)
memory usage: 4.4+ KB
None
| Column Name | Label | |
|---|---|---|
| 0 | GEO_ID | Geography |
| 1 | NAME | Geographic Area Name |
| 2 | DP03_0001E | Estimate!!EMPLOYMENT STATUS!!Population 16 yea… |
| 3 | DP03_0002E | Estimate!!EMPLOYMENT STATUS!!Population 16 yea… |
| 4 | DP03_0003E | Estimate!!EMPLOYMENT STATUS!!Population 16 yea… |
| … | … | … |
| 271 | DP03_0133PE | Percent!!PERCENTAGE OF FAMILIES AND PEOPLE WHO… |
| 272 | DP03_0134PE | Percent!!PERCENTAGE OF FAMILIES AND PEOPLE WHO… |
| 273 | DP03_0135PE | Percent!!PERCENTAGE OF FAMILIES AND PEOPLE WHO… |
| 274 | DP03_0136PE | Percent!!PERCENTAGE OF FAMILIES AND PEOPLE WHO… |
| 275 | DP03_0137PE | Percent!!PERCENTAGE OF FAMILIES AND PEOPLE WHO… |
Let’s reformat the Label column in the metadata DataFrame:
<class 'pandas.core.frame.DataFrame'>
RangeIndex: 276 entries, 0 to 275
Data columns (total 2 columns):
    #   Column       Non-Null Count  Dtype
---  ------       --------------  -----
    0   Column Name  276 non-null    object
    1   Label        276 non-null    object
dtypes: object(2)
memory usage: 4.4+ KB
None
Final State of DP03 at End of Extract Phase
| Column Name | Label | |
|---|---|---|
| 0 | GEO_ID | Geography |
| 1 | NAME | Geographic Area Name |
| 2 | DP03_0001E | EMPLOYMENT STATUS, Population 16 years and over |
| 3 | DP03_0002E | EMPLOYMENT STATUS, Population 16 years and ove… |
| 4 | DP03_0003E | EMPLOYMENT STATUS, Population 16 years and ove… |
| … | … | … |
| 271 | DP03_0133PE | PERCENTAGE OF FAMILIES AND PEOPLE WHOSE INCOME… |
| 272 | DP03_0134PE | PERCENTAGE OF FAMILIES AND PEOPLE WHOSE INCOME… |
| 273 | DP03_0135PE | PERCENTAGE OF FAMILIES AND PEOPLE WHOSE INCOME… |
| 274 | DP03_0136PE | PERCENTAGE OF FAMILIES AND PEOPLE WHOSE INCOME… |
| 275 | DP03_0137PE | PERCENTAGE OF FAMILIES AND PEOPLE WHOSE INCOME… |
TRANSFORM Phase
Data Source 1
NYC311 dataframe info before transformation:
reqs_311_df_merged.info()Dates need to be converted to formal datetime:
date_format_string = '%m/%d/%Y %I:%M:%S %p'
reqs_311_df_merged['created_timestamp'] = pd.to_datetime(reqs_311_df_merged['Created Date'],
                                                         format=date_format_string, errors='coerce')
reqs_311_df_merged['closed_timestamp'] = pd.to_datetime(reqs_311_df_merged['Closed Date'],
                                                        format=date_format_string, errors='coerce')
reqs_311_df_merged['resolution_action_updated_timestamp'] = pd.to_datetime(
    reqs_311_df_merged['Resolution Action Updated Date'],
    format=date_format_string, errors='coerce')

reqs_311_df_merged.drop(columns=['Created Date', 'Closed Date', 'Resolution Action Updated Date'], inplace=True)A closer look at the values in NYC311 dataframe columns for reference/exploration:
for column in reqs_311_df_merged.columns:
    unique_values = reqs_311_df_merged[column].unique()
print(f"Unique values in column '{column}': {unique_values}")We can go ahead drop the rows with no lat/lon data (4,668, or 0.3% of the rows), as we need to join on them:
# Drop rows
reqs_311_df_merged.dropna(subset=['Latitude', 'Longitude'], inplace=True)
reqs_311_df_merged.reset_index(drop=True, inplace=True)

# And look at it
display(reqs_311_df_merged.info())<class 'pandas.core.frame.DataFrame'>
RangeIndex: 1387851 entries, 0 to 1387850
Data columns (total 23 columns):
# Column Non-Null Count Dtype
--- ------ -------------- -----
0 Unique Key 1387851 non-null int64
1 Agency 1387851 non-null object
2 Agency Name 1387851 non-null object
3 Complaint Type 1387851 non-null object
4 Descriptor 1338737 non-null object
5 Location Type 1387851 non-null object
6 Incident Zip 1380082 non-null float64
7 Incident Address 1380117 non-null object
8 Cross Street 2 1378977 non-null object
9 Intersection Street 1 1378129 non-null object
10 Intersection Street 2 1378977 non-null object
11 Address Type 1380106 non-null object
12 City 1304673 non-null object
13 Status 1387851 non-null object
14 Resolution Description 1387798 non-null object
15 Borough 1387851 non-null object
16 Open Data Channel Type 1387851 non-null object
17 Park Facility Name 1386626 non-null object
18 Latitude 1387851 non-null float64
19 Longitude 1387851 non-null float64
20 created_timestamp 1387851 non-null datetime64[ns]
21 closed_timestamp 1387851 non-null datetime64[ns]
22 resolution_action_updated_timestamp 1387756 non-null datetime64[ns]
dtypes: datetime64[ns](3), float64(3), int64(1), object(16)
memory usage: 243.5+ MB
None
We’ll look at the statistics for the difference between resolution_action_updated_timestamp and closed_timestamp. If there is no significant temporal difference, then we’ll drop the resolution timestamp:
reqs_311_df_merged['time_difference'] = (
    reqs_311_df_merged['resolution_action_updated_timestamp'] - reqs_311_df_merged['closed_timestamp'])

print(reqs_311_df_merged['time_difference'].describe())count 1387756
mean 0 days 00:00:04.578057670
std 0 days 00:01:56.895867386
min -1 days +02:37:56
25% 0 days 00:00:04
50% 0 days 00:00:05
75% 0 days 00:00:06
max 0 days 20:55:50
Name: time_difference, dtype: object
That looks like a couple of outliers, with a minute or two difference in between: drop it.
reqs_311_df_merged.drop(
columns=['resolution_action_updated_timestamp', 'time_difference'], inplace=True)Normalization
Agency
We need to normalize the agency information in preparation for creating a lookup table, even though these data only include NYPD calls. If we use the full 311 dataset at some future point in time, this will be necessary for our relational database.
agencies_df = reqs_311_df_merged[['Agency', 'Agency Name']].drop_duplicates().reset_index(drop=True)
agencies_df['agency_id'] = agencies_df.index + 1

reqs_311_df_merged = pd.merge(reqs_311_df_merged, agencies_df, on=['Agency', 'Agency Name'], how='left')
reqs_311_df_merged.drop(columns=['Agency', 'Agency Name'], inplace=True)

display(agencies_df)
display(reqs_311_df_merged.head())| Agency | Agency Name | agency_id | |
|---|---|---|---|
| 0 | NYPD | New York City Police Department | 1 |
| Unique Key | Complaint Type | Descriptor | Location Type | Incident Zip | Incident Address | Cross Street 2 | Intersection Street 1 | Intersection Street 2 | Address Type | … | Status | Resolution Description | Borough | Open Data Channel Type | Park Facility Name | Latitude | Longitude | created_timestamp | closed_timestamp | agency_id | |
|---|---|---|---|---|---|---|---|---|---|---|---|---|---|---|---|---|---|---|---|---|---|
| 0 | 59889383 | Noise - Street/Sidewalk | Loud Music/Party | Street/Sidewalk | 11375.0 | 63-10 108 STREET | 63 ROAD | 63 AVENUE | 63 ROAD | ADDRESS | … | Closed | The Police Department responded to tde complai… | QUEENS | MOBILE | Unspecified | 40.734695 | -73.850521 | 2023-12-31 23:59:42 | 2024-01-01 01:51:01 | 1 |
| 1 | 59893860 | Noise - Street/Sidewalk | Loud Music/Party | Street/Sidewalk | 11374.0 | 65-09 99 STREET | 65 ROAD | 65 AVENUE | 65 ROAD | ADDRESS | … | Closed | The Police Department responded to tde complai… | QUEENS | MOBILE | Unspecified | 40.729379 | -73.855433 | 2023-12-31 23:59:29 | 2024-01-01 01:51:32 | 1 |
| 2 | 59892892 | Blocked Driveway | Partial Access | Street/Sidewalk | 11355.0 | 143-34 BARCLAY AVENUE | PARSONS BOULEVARD | BOWNE STREET | PARSONS BOULEVARD | ADDRESS | … | Closed | The Police Department responded to tde complai… | QUEENS | MOBILE | Unspecified | 40.759286 | -73.822614 | 2023-12-31 23:59:29 | 2024-01-01 04:06:24 | 1 |
| 3 | 59887231 | Noise - Street/Sidewalk | Loud Music/Party | Street/Sidewalk | 11232.0 | 870 42 STREET | 9 AVENUE | 8 AVENUE | 9 AVENUE | ADDRESS | … | Closed | The Police Department responded to tde complai… | BROOKLYN | MOBILE | Unspecified | 40.644725 | -73.997622 | 2023-12-31 23:59:23 | 2024-01-01 00:13:30 | 1 |
| 4 | 59893808 | Illegal Parking | Blocked Hydrant | Street/Sidewalk | 11228.0 | 8842 7 AVENUE | 90 STREET | DE RUSSY DRIVE | 90 STREET | ADDRESS | … | Closed | The Police Department responded to tde complai… | BROOKLYN | MOBILE | Unspecified | 40.616951 | -74.021857 | 2023-12-31 23:59:18 | 2024-01-01 02:08:19 | 1 |
Boroughs
reqs_311_df_merged = reqs_311_df_merged[reqs_311_df_merged['Borough'] != 'Unspecified'].copy()

borough_data = {'borough_id': [1, 2, 3, 4, 5],
    'borough_name': ['MANHATTAN', 'BRONX', 'BROOKLYN', 'QUEENS', 'STATEN ISLAND']}
boroughs_df = pd.DataFrame(borough_data)

borough_map = boroughs_df.set_index('borough_name')['borough_id'].to_dict()

reqs_311_df_merged['borough_id'] = reqs_311_df_merged['Borough'].map(borough_map)
reqs_311_df_merged.drop(columns=['Borough'], inplace=True)

display(boroughs_df)| borough_id | borough_name | |
|---|---|---|
| 0 | 1 | MANHATTAN |
| 1 | 2 | BRONX |
| 2 | 3 | BROOKLYN |
| 3 | 4 | QUEENS |
| 4 | 5 | STATEN ISLAND |
This comports with the NYC Data coding.
Status
statuses_df = pd.DataFrame(reqs_311_df_merged['Status'].unique(), columns=['status_name'])
statuses_df['status_id'] = statuses_df.index + 1

reqs_311_df_merged = pd.merge(reqs_311_df_merged, statuses_df, left_on='Status',
                              right_on='status_name', how='left')
reqs_311_df_merged.drop(columns=['Status', 'status_name'], inplace=True)

display(statuses_df)| status_name | status_id | |
|---|---|---|
| 0 | Closed | 1 |
| 1 | Unspecified | 2 |
Location
reqs_311_df_merged['Location Type'] = reqs_311_df_merged['Location Type'].fillna('Unknown')

location_types_df = pd.DataFrame(reqs_311_df_merged['Location Type'].unique(), columns=['location_type_name'])
location_types_df['location_type_id'] = location_types_df.index + 1

reqs_311_df_merged = pd.merge(reqs_311_df_merged, location_types_df, left_on='Location Type',
                              right_on='location_type_name', how='left')

reqs_311_df_merged.drop(columns=['Location Type', 'location_type_name'], inplace=True)

display(location_types_df)| location_type_name | location_type_id | |
|---|---|---|
| 0 | Street/Sidewalk | 1 |
| 1 | Residential Building/House | 2 |
| 2 | Club/Bar/Restaurant | 3 |
| 3 | Park/Playground | 4 |
| 4 | Store/Commercial | 5 |
| 5 | House of Worship | 6 |
| 6 | Subway | 7 |
| 7 | Pier | 8 |
| 8 | Parking Lot | 9 |
| 9 | Otder | 10 |
| 10 | Stairwell | 11 |
| 11 | Residential Building | 12 |
| 12 | Lobby | 13 |
| 13 | House and Store | 14 |
| 14 | Vacant Lot | 15 |
| 15 | Common Area | 16 |
| 16 | Hallway | 17 |
| 17 | Subway Station | 18 |
| 18 | Commercial | 19 |
| 19 | Bridge | 20 |
| 20 | Highway | 21 |
| 21 | Roadway Tunnel | 22 |
Complaint Type and Descriptor
reqs_311_df_merged['Descriptor'] = reqs_311_df_merged['Descriptor'].fillna('Not Provided')

complaint_types_df = pd.DataFrame(reqs_311_df_merged['Complaint Type'].unique(), columns=['complaint_type_name'])
complaint_types_df['complaint_type_id'] = complaint_types_df.index + 1

unique_pairs = reqs_311_df_merged[['Complaint Type', 'Descriptor']].drop_duplicates().reset_index(drop=True)
unique_pairs['descriptor_id'] = unique_pairs.index + 1

descriptors_df = pd.merge(unique_pairs, complaint_types_df, left_on='Complaint Type', right_on='complaint_type_name')

descriptors_df = descriptors_df[['descriptor_id', 'Descriptor', 'complaint_type_id']]
descriptors_df.rename(columns={'Descriptor': 'descriptor_name'}, inplace=True)

reqs_311_df_merged = pd.merge(reqs_311_df_merged, unique_pairs, on=['Complaint Type', 'Descriptor'], how='left')

reqs_311_df_merged.drop(columns=['Complaint Type', 'Descriptor'], inplace=True)

display(complaint_types_df.head())
display(descriptors_df.head())| complaint_type_name | complaint_type_id | |
|---|---|---|
| 0 | Noise - Street/Sidewalk | 1 |
| 1 | Blocked Driveway | 2 |
| 2 | Illegal Parking | 3 |
| 3 | Noise - Residential | 4 |
| 4 | Noise - Commercial | 5 |
| descriptor_id | descriptor_name | complaint_type_id | |
|---|---|---|---|
| 0 | 1 | Loud Music/Party | 1 |
| 1 | 2 | Partial Access | 2 |
| 2 | 3 | Blocked Hydrant | 3 |
| 3 | 4 | Loud Music/Party | 4 |
| 4 | 5 | Loud Music/Party | 5 |
Resolution Description
It would seem whenever NYPD inputs a Resolution Description that they have a drop-down menu with a set of canned responses, so we can normalize this as well:
# Show all unique values
unique_values = reqs_311_df_merged['Resolution Description'].unique()
print(f"Unique values in column 'Resolution Description': {unique_values}")Unique values in column 'Resolution Description': ['The Police Department responded to the complaint and with the information available observed no evidence of the violation at that time.'
'The Police Department responded to the complaint and took action to fix the condition.'
'The Police Department responded to the complaint but officers were unable to gain entry into the premises.'
'The Police Department issued a summons in response to the complaint.'
'The Police Department responded to the complaint and determined that police action was not necessary.'
'The Police Department responded and upon arrival those responsible for the condition were gone.'
'Your request can not be processed at this time because of insufficient contact information. Please create a new Service Request on NYC.gov and provide more detailed contact information.'
'The Police Department reviewed your complaint and provided additional information below.'
"This complaint does not fall under the Police Department's jurisdiction."
'The Police Department responded to the complaint and a report was prepared.'
'The Police Department visited the location and has referred the complaint to the Department of Homeless Services (DHS) for further action. DHS will inspect the condition and update your Service Request with more information.'
'The Police Department visited the location and no Encampment was found.'
'The Police Department made an arrest in response to the complaint.' nan
'Your complaint has been received by the Police Department and additional information will be available later.'
'Your complaint has been received by the Police Department and it has been determined that a long-term investigation may be necessary. Additional information will be available at the conclusion of the investigation.']
Normalize resolution description:
reqs_311_df_merged['Resolution Description'] = reqs_311_df_merged['Resolution Description'].fillna('Not Provided')

resolution_outcomes_df = pd.DataFrame(reqs_311_df_merged['Resolution Description'].unique(), columns=['outcome_description'])
resolution_outcomes_df['outcome_id'] = resolution_outcomes_df.index + 1

reqs_311_df_merged = pd.merge(reqs_311_df_merged, resolution_outcomes_df, left_on='Resolution Description',
                              right_on='outcome_description', how='left')
reqs_311_df_merged.drop(columns=['Resolution Description', 'outcome_description'], inplace=True)

display(resolution_outcomes_df)| outcome_description | outcome_id | |
|---|---|---|
| 0 | The Police Department responded to the complai… | 1 |
| 1 | The Police Department responded to the complai… | 2 |
| 2 | The Police Department responded to the complai… | 3 |
| 3 | The Police Department issued a summons in resp… | 4 |
| 4 | The Police Department responded to the complai… | 5 |
| 5 | The Police Department responded and upon arriv… | 6 |
| 6 | Your request can not be processed at this time… | 7 |
| 7 | The Police Department reviewed your complaint … | 8 |
| 8 | This complaint does not fall under the Police … | 9 |
| 9 | The Police Department responded to the complai… | 10 |
| 10 | The Police Department visited the location and… | 11 |
| 11 | The Police Department visited the location and… | 12 |
| 12 | The Police Department made an arrest in respon… | 13 |
| 13 | Not Provided | 14 |
| 14 | Your complaint has been received by the Police… | 15 |
| 15 | Your complaint has been received by the Police… | 16 |
Current look at the DataFrame for Data Source 1:
reqs_311_df_merged.head()| Unique Key | Incident Zip | Incident Address | Cross Street 2 | Intersection Street 1 | Intersection Street 2 | Address Type | City | Open Data Channel Type | Park Facility Name | Latitude | Longitude | created_timestamp | closed_timestamp | agency_id | borough_id | status_id | location_type_id | descriptor_id | outcome_id | |
|---|---|---|---|---|---|---|---|---|---|---|---|---|---|---|---|---|---|---|---|---|
| 0 | 59889383 | 11375.0 | 63-10 108 STREET | 63 ROAD | 63 AVENUE | 63 ROAD | ADDRESS | FOREST HILLS | MOBILE | Unspecified | 40.734695 | -73.850521 | 2023-12-31 23:59:42 | 2024-01-01 01:51:01 | 1 | 4 | 1 | 1 | 1 | 1 |
| 1 | 59893860 | 11374.0 | 65-09 99 STREET | 65 ROAD | 65 AVENUE | 65 ROAD | ADDRESS | REGO PARK | MOBILE | Unspecified | 40.729379 | -73.855433 | 2023-12-31 23:59:29 | 2024-01-01 01:51:32 | 1 | 4 | 1 | 1 | 1 | 1 |
| 2 | 59892892 | 11355.0 | 143-34 BARCLAY AVENUE | PARSONS BOULEVARD | BOWNE STREET | PARSONS BOULEVARD | ADDRESS | FLUSHING | MOBILE | Unspecified | 40.759286 | -73.822614 | 2023-12-31 23:59:29 | 2024-01-01 04:06:24 | 1 | 4 | 1 | 1 | 2 | 1 |
| 3 | 59887231 | 11232.0 | 870 42 STREET | 9 AVENUE | 8 AVENUE | 9 AVENUE | ADDRESS | BROOKLYN | MOBILE | Unspecified | 40.644725 | -73.997622 | 2023-12-31 23:59:23 | 2024-01-01 00:13:30 | 1 | 3 | 1 | 1 | 1 | 2 |
| 4 | 59893808 | 11228.0 | 8842 7 AVENUE | 90 STREET | DE RUSSY DRIVE | 90 STREET | ADDRESS | BROOKLYN | MOBILE | Unspecified | 40.616951 | -74.021857 | 2023-12-31 23:59:18 | 2024-01-01 02:08:19 | 1 | 3 | 1 | 1 | 3 | 1 |
# LOOKING GOOD... A FEW MORE TO NORMALIZE...Address Type
reqs_311_df_merged['Address Type'] = reqs_311_df_merged['Address Type'].fillna('UNKNOWN')

address_types_df = pd.DataFrame(reqs_311_df_merged['Address Type'].unique(), columns=['address_type_name'])
address_types_df['address_type_id'] = address_types_df.index + 1

reqs_311_df_merged = pd.merge(reqs_311_df_merged, address_types_df, left_on='Address Type', right_on='address_type_name', how='left')
reqs_311_df_merged.drop(columns=['Address Type', 'address_type_name'], inplace=True)

display(address_types_df)| address_type_name | address_type_id | |
|---|---|---|
| 0 | ADDRESS | 1 |
| 1 | INTERSECTION | 2 |
| 2 | UNKNOWN | 3 |
| 3 | BLOCKFACE | 4 |
| 4 | UNRECOGNIZED | 5 |
| 5 | BBL | 6 |
City
reqs_311_df_merged['City'] = reqs_311_df_merged['City'].fillna('UNKNOWN').str.upper().str.strip()

cities_df = pd.DataFrame(reqs_311_df_merged['City'].unique(), columns=['city_name'])
cities_df['city_id'] = cities_df.index + 1

reqs_311_df_merged = pd.merge(reqs_311_df_merged, cities_df, left_on='City', right_on='city_name', how='left')
reqs_311_df_merged.drop(columns=['City', 'city_name'], inplace=True)

display(cities_df)...View Full Normalized Data Table...
| city_name | city_id | |
|---|---|---|
| 0 | FOREST HILLS | 1 |
| 1 | REGO PARK | 2 |
| 2 | FLUSHING | 3 |
| 3 | BROOKLYN | 4 |
| 4 | BRONX | 5 |
| 5 | FLORAL PARK | 6 |
| 6 | NEW YORK | 7 |
| 7 | SAINT ALBANS | 8 |
| 8 | WOODSIDE | 9 |
| 9 | JAMAICA | 10 |
| 10 | ASTORIA | 11 |
| 11 | UNKNOWN | 12 |
| 12 | STATEN ISLAND | 13 |
| 13 | RICHMOND HILL | 14 |
| 14 | WOODHAVEN | 15 |
| 15 | JACKSON HEIGHTS | 16 |
| 16 | WHITESTONE | 17 |
| 17 | OZONE PARK | 18 |
| 18 | RIDGEWOOD | 19 |
| 19 | LITTLE NECK | 20 |
| 20 | CORONA | 21 |
| 21 | MASPETH | 22 |
| 22 | MIDDLE VILLAGE | 23 |
| 23 | EAST ELMHURST | 24 |
| 24 | LONG ISLAND CITY | 25 |
| 25 | SOUTH RICHMOND HILL | 26 |
| 26 | OAKLAND GARDENS | 27 |
| 27 | BAYSIDE | 28 |
| 28 | SPRINGFIELD GARDENS | 29 |
| 29 | ELMHURST | 30 |
| 30 | SUNNYSIDE | 31 |
| 31 | BREEZY POINT | 32 |
| 32 | QUEENS VILLAGE | 33 |
| 33 | HOWARD BEACH | 34 |
| 34 | COLLEGE POINT | 35 |
| 35 | HOLLIS | 36 |
| 36 | FAR ROCKAWAY | 37 |
| 37 | ARVERNE | 38 |
| 38 | KEW GARDENS | 39 |
| 39 | BELLEROSE | 40 |
| 40 | FRESH MEADOWS | 41 |
| 41 | SOUTH OZONE PARK | 42 |
| 42 | CAMBRIA HEIGHTS | 43 |
| 43 | ROSEDALE | 44 |
| 44 | GLEN OAKS | 45 |
| 45 | NEW HYDE PARK | 46 |
| 46 | MANHATTAN | 47 |
| 47 | LAGUARDIA AIRPORT | 48 |
| 48 | QUEENS | 49 |
| 49 | PELHAM | 50 |
Open Data Channel Type
The communication type used to make 311 request, normalize and rename channel_type:
reqs_311_df_merged.rename(columns={'Open Data Channel Type': 'channel_type'}, inplace=True)

channel_types_df = pd.DataFrame(reqs_311_df_merged['channel_type'].unique(), columns=['channel_type_name'])
channel_types_df['channel_type_id'] = channel_types_df.index + 1

reqs_311_df_merged = pd.merge(reqs_311_df_merged, channel_types_df, left_on='channel_type', right_on='channel_type_name', how='left')
reqs_311_df_merged.drop(columns=['channel_type', 'channel_type_name'], inplace=True)

display(channel_types_df)| channel_type_name | channel_type_id | |
|---|---|---|
| 0 | MOBILE | 1 |
| 1 | PHONE | 2 |
| 2 | ONLINE | 3 |
| 3 | UNKNOWN | 4 |
| 4 | OTHER | 5 |
Let’s explore the Park Facility Name column and decide what to do with it:
unique_parks_count = reqs_311_df_merged['Park Facility Name'].nunique()
most_common_parks = reqs_311_df_merged['Park Facility Name'].value_counts()

print(f"Number of unique values in 'Park Facility Name': {unique_parks_count}")
print("Most common values:")
display(most_common_parks.head(10))Number of unique values in 'Park Facility Name': 556
Most common values:
| Park Facility Name | count |
|---|---|
| Unspecified | 1378160 |
| Central Park | 1325 |
| Flushing Meadows Corona Park | 691 |
| Union Square Park | 192 |
| Van Cortlandt Park | 187 |
| Sunset Park | 126 |
| Washington Square Park | 122 |
| Travers Park | 100 |
| Prospect Park | 91 |
| J. Hood Wright Park | 84 |
Park Facility Name is 99.4% ‘Unspecified’. Let’s drop it:
reqs_311_df_merged.drop(columns=['Park Facility Name'], inplace=True)Let’s step back and look at the first 5 rows of the DataFrame as it is:
display(reqs_311_df_merged.head())| Unique Key | Incident Zip | Incident Address | Cross Street 2 | Intersection Street 1 | Intersection Street 2 | Latitude | Longitude | created_timestamp | closed_timestamp | agency_id | borough_id | status_id | location_type_id | descriptor_id | outcome_id | address_type_id | city_id | channel_type_id | |
|---|---|---|---|---|---|---|---|---|---|---|---|---|---|---|---|---|---|---|---|
| 0 | 59889383 | 11375.0 | 63-10 108 STREET | 63 ROAD | 63 AVENUE | 63 ROAD | 40.734695 | -73.850521 | 2023-12-31 23:59:42 | 2024-01-01 01:51:01 | 1 | 4 | 1 | 1 | 1 | 1 | 1 | 1 | 1 |
| 1 | 59893860 | 11374.0 | 65-09 99 STREET | 65 ROAD | 65 AVENUE | 65 ROAD | 40.729379 | -73.855433 | 2023-12-31 23:59:29 | 2024-01-01 01:51:32 | 1 | 4 | 1 | 1 | 1 | 1 | 1 | 2 | 1 |
| 2 | 59892892 | 11355.0 | 143-34 BARCLAY AVENUE | PARSONS BOULEVARD | BOWNE STREET | PARSONS BOULEVARD | 40.759286 | -73.822614 | 2023-12-31 23:59:29 | 2024-01-01 04:06:24 | 1 | 4 | 1 | 1 | 2 | 1 | 1 | 3 | 1 |
| 3 | 59887231 | 11232.0 | 870 42 STREET | 9 AVENUE | 8 AVENUE | 9 AVENUE | 40.644725 | -73.997622 | 2023-12-31 23:59:23 | 2024-01-01 00:13:30 | 1 | 3 | 1 | 1 | 1 | 2 | 1 | 4 | 1 |
| 4 | 59893808 | 11228.0 | 8842 7 AVENUE | 90 STREET | DE RUSSY DRIVE | 90 STREET | 40.616951 | -74.021857 | 2023-12-31 23:59:18 | 2024-01-01 02:08:19 | 1 | 3 | 1 | 1 | 3 | 1 | 1 | 4 | 1 |
We can see that Cross Street 2, Intersection Street 1, and Intersection Street 2 are redundant - the location is retrievable by our lat/lon coordinates if necessary. Let’s keep Incident Address as a human-readable identifier for the original request, however.
# Drop 3 Columns
reqs_311_df_merged.drop(columns=['Cross Street 2', 'Intersection Street 1', 'Intersection Street 2'], inplace=True)

# Convert the Incident Zip from a float to a 5-digit string
reqs_311_df_merged['Incident Zip'] = reqs_311_df_merged['Incident Zip'].fillna('00000')
reqs_311_df_merged['Incident Zip'] = reqs_311_df_merged['Incident Zip'].astype(int).astype(str)
reqs_311_df_merged['Incident Zip'] = reqs_311_df_merged['Incident Zip'].str.zfill(5)

display(reqs_311_df_merged['Incident Zip'].head())| Incident Zip | |
|---|---|
| 0 | 11375 |
| 1 | 11374 |
| 2 | 11355 |
| 3 | 11232 |
| 4 | 11228 |
Completed Extract/Transform for reqs_311_df_merged DataFrame (Data Source 1)
display(reqs_311_df_merged)| Unique Key | Incident Zip | Incident Address | Latitude | Longitude | created_timestamp | closed_timestamp | agency_id | borough_id | status_id | location_type_id | descriptor_id | outcome_id | address_type_id | city_id | channel_type_id | |
|---|---|---|---|---|---|---|---|---|---|---|---|---|---|---|---|---|
| 0 | 59889383 | 11375 | 63-10 108 STREET | 40.734695 | -73.850521 | 2023-12-31 23:59:42 | 2024-01-01 01:51:01 | 1 | 4 | 1 | 1 | 1 | 1 | 1 | 1 | 1 |
| 1 | 59893860 | 11374 | 65-09 99 STREET | 40.729379 | -73.855433 | 2023-12-31 23:59:29 | 2024-01-01 01:51:32 | 1 | 4 | 1 | 1 | 1 | 1 | 1 | 2 | 1 |
| 2 | 59892892 | 11355 | 143-34 BARCLAY AVENUE | 40.759286 | -73.822614 | 2023-12-31 23:59:29 | 2024-01-01 04:06:24 | 1 | 4 | 1 | 1 | 2 | 1 | 1 | 3 | 1 |
| 3 | 59887231 | 11232 | 870 42 STREET | 40.644725 | -73.997622 | 2023-12-31 23:59:23 | 2024-01-01 00:13:30 | 1 | 3 | 1 | 1 | 1 | 2 | 1 | 4 | 1 |
| 4 | 59893808 | 11228 | 8842 7 AVENUE | 40.616951 | -74.021857 | 2023-12-31 23:59:18 | 2024-01-01 02:08:19 | 1 | 3 | 1 | 1 | 3 | 1 | 1 | 4 | 1 |
| … | … | … | … | … | … | … | … | … | … | … | … | … | … | … | … | … |
| 1386043 | 56418977 | 11429 | 206-20 104 AVENUE | 40.710379 | -73.752158 | 2023-01-01 00:01:38 | 2023-01-01 03:24:32 | 1 | 4 | 1 | 2 | 4 | 2 | 1 | 33 | 3 |
| 1386044 | 56418136 | 11234 | 1621 EAST 51 STREET | 40.620665 | -73.926040 | 2023-01-01 00:00:46 | 2023-01-01 01:01:43 | 1 | 3 | 1 | 2 | 4 | 1 | 1 | 4 | 3 |
| 1386045 | 56418795 | 10001 | 15 HUDSON BOULEVARD | 40.754875 | -74.000747 | 2023-01-01 00:00:45 | 2023-01-01 01:24:10 | 1 | 1 | 1 | 1 | 10 | 5 | 1 | 7 | 1 |
| 1386046 | 56416252 | 10453 | 1871 SEDGWICK AVENUE | 40.853848 | -73.917709 | 2023-01-01 00:00:42 | 2023-01-01 17:34:15 | 1 | 2 | 1 | 2 | 4 | 1 | 1 | 5 | 3 |
| 1386047 | 56417527 | 11218 | AVENUE C | 40.640915 | -73.973642 | 2023-01-01 00:00:09 | 2023-01-01 00:36:06 | 1 | 3 | 1 | 1 | 8 | 2 | 2 | 12 | 3 |
Data Source 2
Let’s take a close look at the values in NYC Parking dataframe columns:
for column in parking_df.columns:
    unique_values = parking_df[column].unique()
print(f"Unique values in column '{column}': {unique_values}")Normalization
Link borough to existing boroughs_df table:
parking_df['borough'] = parking_df['borough'].str.upper().str.strip()

parking_df['borough_id'] = parking_df['borough'].map(borough_map)

parking_df.drop(columns=['borough'], inplace=True)Remove from_street, from_street_suffix, to_street, and to_street_suffix columns. As in the previous dataframe, we will retain the primary street human-readable column(s), dropping the redundant intersection info that can be retrieved from lat/lon if needed.
cross_street_cols_to_drop = ['from_street', 'from_street_suffix', 'to_street', 'to_street_suffix']

parking_df.drop(columns=cross_street_cols_to_drop, inplace=True)Create directions_df and side_of_street_id column in parking_df
directions = ['N', 'NE', 'E', 'SE', 'S', 'SW', 'W', 'NW', 'EW', 'NS']
directions_df = pd.DataFrame(directions, columns=['direction_name'])
directions_df['direction_id'] = directions_df.index + 1

parking_df = pd.merge(parking_df, directions_df, left_on='side_of_street',
                      right_on='direction_name', how='left')

parking_df.drop(columns=['side_of_street', 'direction_name'], inplace=True)
parking_df.rename(columns={'direction_id': 'side_of_street_id'}, inplace=True)

display(directions_df)| direction_name | direction_id | |
|---|---|---|
| 0 | N | 1 |
| 1 | NE | 2 |
| 2 | E | 3 |
| 3 | SE | 4 |
| 4 | S | 5 |
| 5 | SW | 6 |
| 6 | W | 7 |
| 7 | NW | 8 |
| 8 | EW | 9 |
| 9 | NS | 10 |
sign_code and sign_description
sign_code is a key that identifies a specific sign description. We will create a single lookup table for these pairs and keep only the sign_code in the main table as a foreign key to avoid redundancy.
sign_types_df = parking_df[['sign_code', 'sign_description']].drop_duplicates().reset_index(drop=True)

parking_df.drop(columns=['sign_description'], inplace=True)

display(sign_types_df.head())| sign_code | sign_description | |
|---|---|---|
| 0 | PS-2GA | NO PARKING ANYTIME –> (SUPERSEDES SP-854CA) |
| 1 | PS-127C | 2 HMP SATURDAY 8AM-7PM <-> |
| 2 | PS-191EA | TRUCK (SYMBOL) TRUCK LOADING ONLY MONDAY-FRIDA… |
| 3 | PS-528C | 1 HMP COMMERCIAL VEHICLES ONLY MONDAY-FRIDAY 8… |
| 4 | SI-1878G | LOCAL MTA BUS ROUTE PANEL (TEXT TO BE MODIFIED… |
The DataFrame so far:
parking_df.info()<class 'pandas.core.frame.DataFrame'>
RangeIndex: 404140 entries, 0 to 404139
Data columns (total 11 columns):
# Column Non-Null Count Dtype
--- ------ -------------- -----
0 on_street 404140 non-null object
1 on_street_suffix 9116 non-null object
2 sign_code 404140 non-null object
3 sign_size 403397 non-null object
4 distance_from_intersection 404140 non-null int64
5 arrow_direction 97358 non-null object
6 facing_direction 1329 non-null object
7 latitude 404140 non-null float64
8 longitude 404140 non-null float64
9 borough_id 404140 non-null int64
10 side_of_street_id 404140 non-null int64
dtypes: float64(2), int64(3), object(6)
memory usage: 33.9+ MB
sign_size
parking_df['sign_size'] = parking_df['sign_size'].fillna('UNKNOWN')

sign_sizes_df = pd.DataFrame(parking_df['sign_size'].unique(), columns=['size_name'])
sign_sizes_df['size_id'] = sign_sizes_df.index + 1

parking_df = pd.merge(parking_df, sign_sizes_df, left_on='sign_size', right_on='size_name', how='left')

parking_df.drop(columns=['sign_size', 'size_name'], inplace=True)

display(sign_sizes_df)| size_name | size_id | |
|---|---|---|
| 0 | 018 X 012 | 1 |
| 1 | 018 X 018 | 2 |
| 2 | 018 X 024 | 3 |
| 3 | 14.12 X 6 | 4 |
| 4 | 016 X 008 | 5 |
| … | … | … |
| 76 | 024 X 042 | 77 |
| 77 | 036 X 006 | 78 |
| 78 | 036 X 009 | 79 |
| 79 | 024 X 015 | 80 |
| 80 | 030 X 048 | 81 |
Let’s analyze the distance_from_intersection column based on its statistical distribution. This will tell us if the values are meaningful or not.
print(parking_df['distance_from_intersection'].describe())
``
```console
count    404140.000000
mean        281.387039
std         335.143021
min           0.000000
25%          96.000000
50%         190.000000
75%         374.000000
max        8605.000000
Name: distance_from_intersection, dtype: float64That’s a good spread of data - let’s keep it.
arrow_directions and facing_direction
direction_standardization_map = {'North': 'N', 'South': 'S', 'East': 'E', 'West': 'W'}

parking_df['arrow_direction'] = parking_df['arrow_direction'].replace(direction_standardization_map)
parking_df['facing_direction'] = parking_df['facing_direction'].replace(direction_standardization_map)

direction_map = directions_df.set_index('direction_name')['direction_id'].to_dict()

parking_df['arrow_direction_id'] = parking_df['arrow_direction'].map(direction_map)
parking_df['arrow_direction_id'] = parking_df['arrow_direction_id'].astype('Int64')

parking_df['facing_direction_id'] = parking_df['facing_direction'].map(direction_map)
parking_df['facing_direction_id'] = parking_df['facing_direction_id'].astype('Int64')

parking_df.drop(columns=['arrow_direction', 'facing_direction'], inplace=True)Completed Extract/Transform for parking_df DataFrame (Data Source 2)
display(parking_df.info())
display(parking_df)<class 'pandas.core.frame.DataFrame'>
RangeIndex: 404140 entries, 0 to 404139
Data columns (total 11 columns):
# Column Non-Null Count Dtype
--- ------ -------------- -----
0 on_street 404140 non-null object
1 on_street_suffix 9116 non-null object
2 sign_code 404140 non-null object
3 distance_from_intersection 404140 non-null int64
4 latitude 404140 non-null float64
5 longitude 404140 non-null float64
6 borough_id 404140 non-null int64
7 side_of_street_id 404140 non-null int64
8 size_id 404140 non-null int64
9 arrow_direction_id 97358 non-null Int64
10 facing_direction_id 1329 non-null Int64
dtypes: Int64(2), float64(2), int64(4), object(3)
memory usage: 34.7+ MB
None
| on_street | on_street_suffix | sign_code | distance_from_intersection | latitude | longitude | borough_id | side_of_street_id | size_id | arrow_direction_id | facing_direction_id | |
|---|---|---|---|---|---|---|---|---|---|---|---|
| 0 | HENDRIX STREET | NaN | PS-2GA | 487 | 40.663169 | -73.886449 | 3 | 3 | 1 | 5 | <NA> |
| 1 | 3 AVENUE | NaN | PS-127C | 44 | 40.778243 | -73.954408 | 1 | 7 | 2 | <NA> | <NA> |
| 2 | EAST 217 STREET | NaN | PS-191EA | 146 | 40.882009 | -73.862959 | 2 | 1 | 2 | 7 | <NA> |
| 3 | 3 AVENUE | NaN | PS-528C | 44 | 40.778243 | -73.954408 | 1 | 7 | 3 | <NA> | <NA> |
| 4 | NORTHERN BOULEVARD | NaN | SI-1878G | 101 | 40.769918 | -73.735961 | 4 | 5 | 4 | <NA> | <NA> |
| … | … | … | … | … | … | … | … | … | … | … | … |
| 404135 | COLLEGE POINT BOULEVARD | NaN | SP-477BA | 92 | 40.778605 | -73.846111 | 4 | 7 | 9 | 1 | <NA> |
| 404136 | EINSTEIN LOOP NORTH | NaN | PS-3AA | 399 | 40.865519 | -73.822793 | 2 | 1 | 1 | 3 | <NA> |
| 404137 | 108 STREET | NaN | SI-1879G | 95 | 40.754642 | -73.860424 | 4 | 3 | 8 | <NA> | <NA> |
| 404138 | 108 STREET | NaN | SP-477BA | 95 | 40.724057 | -73.845040 | 4 | 7 | 9 | 1 | <NA> |
| 404139 | 37 AVENUE | NaN | SI-1878G | 202 | 40.753452 | -73.863725 | 4 | 5 | 4 | <NA> | <NA> |
Data Source 3
Let’s take a closer look at the column values in the DP03 Census dataframe:
first_2 = ['GEO_ID', 'NAME']

for column in first_2:
    unique_values = census_df[column].unique()
print(f"Unique values in column '{column}': {unique_values}")Unique values in column 'GEO_ID': ['Geography' '860Z200US06390' '860Z200US10001' ... '860Z200US14903'
'860Z200US14904' '860Z200US14905']
Unique values in column 'NAME': ['Geographic Area Name' 'ZCTA5 06390' 'ZCTA5 10001' ... 'ZCTA5 14903'
'ZCTA5 14904' 'ZCTA5 14905']
census_df.info()<class 'pandas.core.frame.DataFrame'>
RangeIndex: 1825 entries, 0 to 1824
Columns: 276 entries, GEO_ID to DP03_0137PE
dtypes: object(276)
memory usage: 3.8+ MB
A closer look at the column values in the DP03 Column Metadata dataframe:
for column in dp03_col_metadata_df.columns:
    unique_values = dp03_col_metadata_df[column].unique()
print(f"Unique values in column '{column}': {unique_values}")Continue inspection:
dp03_col_metadata_df.info()<class 'pandas.core.frame.DataFrame'>
RangeIndex: 276 entries, 0 to 275
Data columns (total 2 columns):
# Column Non-Null Count Dtype
--- ------ -------------- -----
0 Column Name 276 non-null object
1 Label 276 non-null object
dtypes: object(2)
memory usage: 4.4+ KB
dp03_col_metadata_df| Column Name | Label | |
|---|---|---|
| 0 | GEO_ID | Geography |
| 1 | NAME | Geographic Area Name |
| 2 | DP03_0001E | EMPLOYMENT STATUS, Population 16 years and over |
| 3 | DP03_0002E | EMPLOYMENT STATUS, Population 16 years and ove… |
| 4 | DP03_0003E | EMPLOYMENT STATUS, Population 16 years and ove… |
| … | … | … |
| 271 | DP03_0133PE | PERCENTAGE OF FAMILIES AND PEOPLE WHOSE INCOME… |
| 272 | DP03_0134PE | PERCENTAGE OF FAMILIES AND PEOPLE WHOSE INCOME… |
| 273 | DP03_0135PE | PERCENTAGE OF FAMILIES AND PEOPLE WHOSE INCOME… |
| 274 | DP03_0136PE | PERCENTAGE OF FAMILIES AND PEOPLE WHOSE INCOME… |
| 275 | DP03_0137PE | PERCENTAGE OF FAMILIES AND PEOPLE WHOSE INCOME… |
Normalization
Transform the dp03_col_metadata_df Census metadata by splitting the Label string and padding the resulting list with NaNs at the beginning. This allows us to drill down to the true category, which we will label metric_name:
metadata_clean = dp03_col_metadata_df.iloc[2:].reset_index(drop=True)

split_labels = metadata_clean['Label'].str.split(', ')
max_depth = split_labels.str.len().max()

def pad_list_front(lst, target_len):
    padding_needed = target_len - len(lst)
    return [np.nan] * padding_needed + lst

padded_labels = split_labels.apply(lambda x: pad_list_front(x, max_depth))

hierarchy_df = pd.DataFrame(padded_labels.tolist(), columns=[f'category_l{i+1}' for i in range(max_depth)])

census_metadata_df = pd.concat([metadata_clean[['Column Name']], hierarchy_df], axis=1)
census_metadata_df.rename(columns={'Column Name': 'metric_id',
                                   f'category_l{max_depth}': 'metric_name'}, inplace=True)

display(census_metadata_df.head())| metric_id | category_l1 | category_l2 | category_l3 | category_l4 | category_l5 | metric_name | |
|---|---|---|---|---|---|---|---|
| 0 | DP03_0001E | NaN | NaN | NaN | NaN | EMPLOYMENT STATUS | Population 16 years and over |
| 1 | DP03_0002E | NaN | NaN | NaN | EMPLOYMENT STATUS | Population 16 years and over | In labor force |
| 2 | DP03_0003E | NaN | NaN | EMPLOYMENT STATUS | Population 16 years and over | In labor force | Civilian labor force |
| 3 | DP03_0004E | NaN | EMPLOYMENT STATUS | Population 16 years and over | In labor force | Civilian labor force | Employed |
| 4 | DP03_0005E | NaN | EMPLOYMENT STATUS | Population 16 years and over | In labor force | Civilian labor force | Unemployed |
census_df
We will drop the initial header row, clean the GEO_ID to create a 5-digit zip code, drop the redundant NAME column, and convert all data columns to numeric format:
census_df = census_df.iloc[1:].reset_index(drop=True)

census_df['zip_code'] = census_df['GEO_ID'].str.slice(-5)

census_df.drop(columns=['GEO_ID', 'NAME'], inplace=True)

for col in census_df.columns:
  if col != 'zip_code':   # Had to add this to fix type error at load stage
census_df[col] = pd.to_numeric(census_df[col], errors='coerce')display(census_df.info())<class 'pandas.core.frame.DataFrame'>
RangeIndex: 1824 entries, 0 to 1823
Columns: 275 entries, DP03_0001E to zip_code
dtypes: float64(154), int64(120), object(1)
memory usage: 3.8+ MB
None
display(census_df)| DP03_0001E | DP03_0002E | DP03_0003E | DP03_0004E | DP03_0005E | DP03_0006E | DP03_0007E | DP03_0008E | DP03_0009E | DP03_0010E | … | DP03_0129PE | DP03_0130PE | DP03_0131PE | DP03_0132PE | DP03_0133PE | DP03_0134PE | DP03_0135PE | DP03_0136PE | DP03_0137PE | zip_code | |
|---|---|---|---|---|---|---|---|---|---|---|---|---|---|---|---|---|---|---|---|---|---|
| 0 | 45 | 33 | 33 | 30 | 3 | 0 | 12 | 33 | NaN | 14 | … | 0.0 | 0.0 | NaN | 0.0 | 0.0 | 0.0 | NaN | 0.0 | 0.0 | 06390 |
| 1 | 25900 | 19082 | 19082 | 17926 | 1156 | 0 | 6818 | 19082 | NaN | 13557 | … | 23.7 | 23.4 | 0.0 | 36.5 | 14.4 | 14.1 | 16.6 | 13.7 | 17.1 | 10001 |
| 2 | 66419 | 37021 | 36991 | 33913 | 3078 | 30 | 29398 | 36991 | NaN | 33629 | … | 37.1 | 37.1 | 30.8 | 38.9 | 23.0 | 20.1 | 31.1 | 22.3 | 29.9 | 10002 |
| 3 | 50449 | 33983 | 33976 | 32313 | 1663 | 7 | 16466 | 33976 | NaN | 26043 | … | 1.2 | 1.1 | 0.0 | 1.8 | 13.6 | 12.8 | 16.8 | 2.8 | 19.4 | 10003 |
| 4 | 3099 | 2555 | 2555 | 2551 | 4 | 0 | 544 | 2555 | NaN | 1316 | … | 4.1 | 4.1 | 8.5 | 0.0 | 4.1 | 4.3 | 0.6 | 2.5 | 6.8 | 10004 |
| … | … | … | … | … | … | … | … | … | … | … | … | … | … | … | … | … | … | … | … | … | … |
| 1819 | 1194 | 651 | 651 | 596 | 55 | 0 | 543 | 651 | NaN | 594 | … | 22.4 | 20.9 | 8.5 | 28.2 | 6.6 | 6.6 | 6.6 | 9.5 | 16.0 | 14898 |
| 1820 | 11637 | 5181 | 5181 | 4831 | 350 | 0 | 6456 | 5181 | NaN | 5531 | … | 34.9 | 34.9 | 26.6 | 36.9 | 25.7 | 28.2 | 18.0 | 23.7 | 38.3 | 14901 |
| 1821 | 6015 | 3689 | 3640 | 3457 | 183 | 49 | 2326 | 3640 | NaN | 3227 | … | 32.3 | 31.3 | 66.0 | 15.4 | 16.5 | 15.3 | 21.0 | 18.9 | 21.6 | 14903 |
| 1822 | 11593 | 7449 | 7449 | 6666 | 783 | 0 | 4144 | 7449 | NaN | 5561 | … | 32.8 | 32.8 | 43.9 | 30.0 | 17.7 | 19.2 | 12.8 | 17.4 | 28.6 | 14904 |
| 1823 | 7214 | 4798 | 4798 | 4499 | 299 | 0 | 2416 | 4798 | NaN | 3940 | … | 19.6 | 19.3 | 25.8 | 17.2 | 12.8 | 13.7 | 10.2 | 11.4 | 25.0 | 14905 |
Spatial Join NYC311 Requests and NYC Parking
We will add a nearest_sign_id column to the Requests DataFrame that allows us to link it with NYC Parking:
# Perform Spatial Join

parking_df['sign_id'] = parking_df.index + 1

signs_gdf = gpd.GeoDataFrame(parking_df[['sign_id']],
                             geometry=gpd.points_from_xy(parking_df.longitude,
                                                         parking_df.latitude),
                             crs="EPSG:4326")

requests_gdf = gpd.GeoDataFrame(reqs_311_df_merged,
                                geometry=gpd.points_from_xy(reqs_311_df_merged['Longitude'],
                                                            reqs_311_df_merged['Latitude']),
                                crs="EPSG:4326")

signs_gdf_proj = signs_gdf.to_crs("EPSG:2263")
requests_gdf_proj = requests_gdf.to_crs("EPSG:2263")

joined_gdf = gpd.sjoin_nearest(left_df=requests_gdf_proj, right_df=signs_gdf_proj, how='left')

joined_gdf.drop(columns=['index_right', 'geometry'], inplace=True)

joined_gdf.rename(columns={'sign_id': 'nearest_sign_id'}, inplace=True)

final_requests_df = joined_gdf

display(final_requests_df.head())| Unique Key | Incident Zip | Incident Address | Latitude | Longitude | created_timestamp | closed_timestamp | agency_id | borough_id | status_id | location_type_id | descriptor_id | outcome_id | address_type_id | city_id | channel_type_id | nearest_sign_id | |
|---|---|---|---|---|---|---|---|---|---|---|---|---|---|---|---|---|---|
| 0 | 59889383 | 11375 | 63-10 108 STREET | 40.734695 | -73.850521 | 2023-12-31 23:59:42 | 2024-01-01 01:51:01 | 1 | 4 | 1 | 1 | 1 | 1 | 1 | 1 | 1 | 358362 |
| 1 | 59893860 | 11374 | 65-09 99 STREET | 40.729379 | -73.855433 | 2023-12-31 23:59:29 | 2024-01-01 01:51:32 | 1 | 4 | 1 | 1 | 1 | 1 | 1 | 2 | 1 | 238634 |
| 2 | 59892892 | 11355 | 143-34 BARCLAY AVENUE | 40.759286 | -73.822614 | 2023-12-31 23:59:29 | 2024-01-01 04:06:24 | 1 | 4 | 1 | 1 | 2 | 1 | 1 | 3 | 1 | 11734 |
| 3 | 59887231 | 11232 | 870 42 STREET | 40.644725 | -73.997622 | 2023-12-31 23:59:23 | 2024-01-01 00:13:30 | 1 | 3 | 1 | 1 | 1 | 2 | 1 | 4 | 1 | 325766 |
| 4 | 59893808 | 11228 | 8842 7 AVENUE | 40.616951 | -74.021857 | 2023-12-31 23:59:18 | 2024-01-01 02:08:19 | 1 | 3 | 1 | 1 | 3 | 1 | 1 | 4 | 1 | 56608 |
Standardize Column Names
A last little bit of cleanup found right before loading…
Convert NYC311 DataFrame to camel case (all lowercase letters separated by underscores):
# Conversion Functions
def to_snake_case(name: str) -> str:

    name = re.sub(r'[\s\-]+', '_', name)

    return name.lower()

def standardize_columns_to_snake_case(df: pd.DataFrame) -> pd.DataFrame:

    new_columns = [to_snake_case(col) for col in df.columns]
    df.columns = new_columns

    return df

# Now standardize
print(f"Original: {final_requests_df.columns.tolist()}")

nyc_311_df = standardize_columns_to_snake_case(final_requests_df)

print(f"Standardized: {nyc_311_df.columns.tolist()}")Original: ['Unique Key', 'Incident Zip', 'Incident Address', 'Latitude', 'Longitude', 'created_timestamp', 'closed_timestamp', 'agency_id', 'borough_id', 'status_id', 'location_type_id', 'descriptor_id', 'outcome_id', 'address_type_id', 'city_id', 'channel_type_id', 'nearest_sign_id']
Standardized: ['unique_key', 'incident_zip', 'incident_address', 'latitude', 'longitude', 'created_timestamp', 'closed_timestamp', 'agency_id', 'borough_id', 'status_id', 'location_type_id', 'descriptor_id', 'outcome_id', 'address_type_id', 'city_id', 'channel_type_id', 'nearest_sign_id']
Inspect again:
nyc_311_df.info()<class 'geopandas.geodataframe.GeoDataFrame'>
Index: 2117842 entries, 0 to 1386047
Data columns (total 17 columns):
# Column Dtype
--- ------ -----
0 unique_key int64
1 incident_zip object
2 incident_address object
3 latitude float64
4 longitude float64
5 created_timestamp datetime64[ns]
6 closed_timestamp datetime64[ns]
7 agency_id int64
8 borough_id int64
9 status_id int64
10 location_type_id int64
11 descriptor_id int64
12 outcome_id int64
13 address_type_id int64
14 city_id int64
15 channel_type_id int64
16 nearest_sign_id int64
dtypes: datetime64[ns](2), float64(2), int64(11), object(2)
memory usage: 290.8+ MB
Let’s get rid of the duplicates in nyc_311_df and convert it from a geodataframe to a standard DataFrame:
# Drop duplicates
nyc_311_df.drop_duplicates(subset=['unique_key'], inplace=True)
nyc_311_df.reset_index(drop=True, inplace=True)

# Show geodataframe
nyc_311_df.info()<class 'geopandas.geodataframe.GeoDataFrame'>
RangeIndex: 1386048 entries, 0 to 1386047
Data columns (total 17 columns):
# Column Non-Null Count Dtype
--- ------ -------------- -----
0 unique_key 1386048 non-null int64
1 incident_zip 1386048 non-null object
2 incident_address 1380078 non-null object
3 latitude 1386048 non-null float64
4 longitude 1386048 non-null float64
5 created_timestamp 1386048 non-null datetime64[ns]
6 closed_timestamp 1386048 non-null datetime64[ns]
7 agency_id 1386048 non-null int64
8 borough_id 1386048 non-null int64
9 status_id 1386048 non-null int64
10 location_type_id 1386048 non-null int64
11 descriptor_id 1386048 non-null int64
12 outcome_id 1386048 non-null int64
13 address_type_id 1386048 non-null int64
14 city_id 1386048 non-null int64
15 channel_type_id 1386048 non-null int64
16 nearest_sign_id 1386048 non-null int64
dtypes: datetime64[ns](2), float64(2), int64(11), object(2)
memory usage: 179.8+ MB
# Convert to standard DataFrame
nyc_311_df = pd.DataFrame(nyc_311_df)

# And display
display(nyc_311_df.info())
display(nyc_311_df)<class 'pandas.core.frame.DataFrame'>
RangeIndex: 1386048 entries, 0 to 1386047
Data columns (total 17 columns):
# Column Non-Null Count Dtype
--- ------ -------------- -----
0 unique_key 1386048 non-null int64
1 incident_zip 1386048 non-null object
2 incident_address 1380078 non-null object
3 latitude 1386048 non-null float64
4 longitude 1386048 non-null float64
5 created_timestamp 1386048 non-null datetime64[ns]
6 closed_timestamp 1386048 non-null datetime64[ns]
7 agency_id 1386048 non-null int64
8 borough_id 1386048 non-null int64
9 status_id 1386048 non-null int64
10 location_type_id 1386048 non-null int64
11 descriptor_id 1386048 non-null int64
12 outcome_id 1386048 non-null int64
13 address_type_id 1386048 non-null int64
14 city_id 1386048 non-null int64
15 channel_type_id 1386048 non-null int64
16 nearest_sign_id 1386048 non-null int64
dtypes: datetime64[ns](2), float64(2), int64(11), object(2)
memory usage: 179.8+ MB
None
| unique_key | incident_zip | incident_address | latitude | longitude | created_timestamp | closed_timestamp | agency_id | borough_id | status_id | location_type_id | descriptor_id | outcome_id | address_type_id | city_id | channel_type_id | nearest_sign_id | |
|---|---|---|---|---|---|---|---|---|---|---|---|---|---|---|---|---|---|
| 0 | 59889383 | 11375 | 63-10 108 STREET | 40.734695 | -73.850521 | 2023-12-31 23:59:42 | 2024-01-01 01:51:01 | 1 | 4 | 1 | 1 | 1 | 1 | 1 | 1 | 1 | 358362 |
| 1 | 59893860 | 11374 | 65-09 99 STREET | 40.729379 | -73.855433 | 2023-12-31 23:59:29 | 2024-01-01 01:51:32 | 1 | 4 | 1 | 1 | 1 | 1 | 1 | 2 | 1 | 238634 |
| 2 | 59892892 | 11355 | 143-34 BARCLAY AVENUE | 40.759286 | -73.822614 | 2023-12-31 23:59:29 | 2024-01-01 04:06:24 | 1 | 4 | 1 | 1 | 2 | 1 | 1 | 3 | 1 | 11734 |
| 3 | 59887231 | 11232 | 870 42 STREET | 40.644725 | -73.997622 | 2023-12-31 23:59:23 | 2024-01-01 00:13:30 | 1 | 3 | 1 | 1 | 1 | 2 | 1 | 4 | 1 | 325766 |
| 4 | 59893808 | 11228 | 8842 7 AVENUE | 40.616951 | -74.021857 | 2023-12-31 23:59:18 | 2024-01-01 02:08:19 | 1 | 3 | 1 | 1 | 3 | 1 | 1 | 4 | 1 | 56608 |
| … | … | … | … | … | … | … | … | … | … | … | … | … | … | … | … | … | … |
| 1386043 | 56418977 | 11429 | 206-20 104 AVENUE | 40.710379 | -73.752158 | 2023-01-01 00:01:38 | 2023-01-01 03:24:32 | 1 | 4 | 1 | 2 | 4 | 2 | 1 | 33 | 3 | 181366 |
| 1386044 | 56418136 | 11234 | 1621 EAST 51 STREET | 40.620665 | -73.926040 | 2023-01-01 00:00:46 | 2023-01-01 01:01:43 | 1 | 3 | 1 | 2 | 4 | 1 | 1 | 4 | 3 | 181090 |
| 1386045 | 56418795 | 10001 | 15 HUDSON BOULEVARD | 40.754875 | -74.000747 | 2023-01-01 00:00:45 | 2023-01-01 01:24:10 | 1 | 1 | 1 | 1 | 10 | 5 | 1 | 7 | 1 | 316287 |
| 1386046 | 56416252 | 10453 | 1871 SEDGWICK AVENUE | 40.853848 | -73.917709 | 2023-01-01 00:00:42 | 2023-01-01 17:34:15 | 1 | 2 | 1 | 2 | 4 | 1 | 1 | 5 | 3 | 58756 |
| 1386047 | 56417527 | 11218 | AVENUE C | 40.640915 | -73.973642 | 2023-01-01 00:00:09 | 2023-01-01 00:36:06 | 1 | 3 | 1 | 1 | 8 | 2 | 2 | 12 | 3 | 185215 |
Looks nice and clean.
Let’s standardize all of the dataframes that need it (turns out it’s only agencies_df):
# Standardize
print(agencies_df.columns.tolist())
temp_df = agencies_df.copy()
agencies_df = standardize_columns_to_snake_case(temp_df)

# To fix schema mismatch found later
agencies_df.rename(columns={'agency': 'agency_abbreviation'}, inplace=True)

print(agencies_df.columns.tolist())Original: ['Agency', 'Agency Name', 'agency_id']
Standardized: ['agency_abbreviation', 'agency_name', 'agency_id']
census_df needs re-indexing:
census_df.reset_index(drop=True, inplace=True)

census_df.info()<class 'pandas.core.frame.DataFrame'>
RangeIndex: 1824 entries, 0 to 1823
Columns: 275 entries, DP03_0001E to zip_code
dtypes: float64(154), int64(120), object(1)
memory usage: 3.8+ MB
Some zip codes in nyc_311_df are not present in census_df, thereby creating a foreign key violation later in our process. We’re back from the future to fix it:
valid_zips = set(census_df['zip_code'])

original_rows = len(nyc_311_df)
nyc_311_df_filtered = nyc_311_df[nyc_311_df['incident_zip'].isin(valid_zips)].copy()
filtered_rows = len(nyc_311_df_filtered)

print(f"Original service requests: {original_rows}")
print(f"Service requests with valid zips: {filtered_rows}")
print(f"Rows removed: {original_rows - filtered_rows}")Original service requests: 1386048
Service requests with valid zips: 1379596
Rows removed: 6452
Transform Phase Complete!
Final Database Schema Diagram
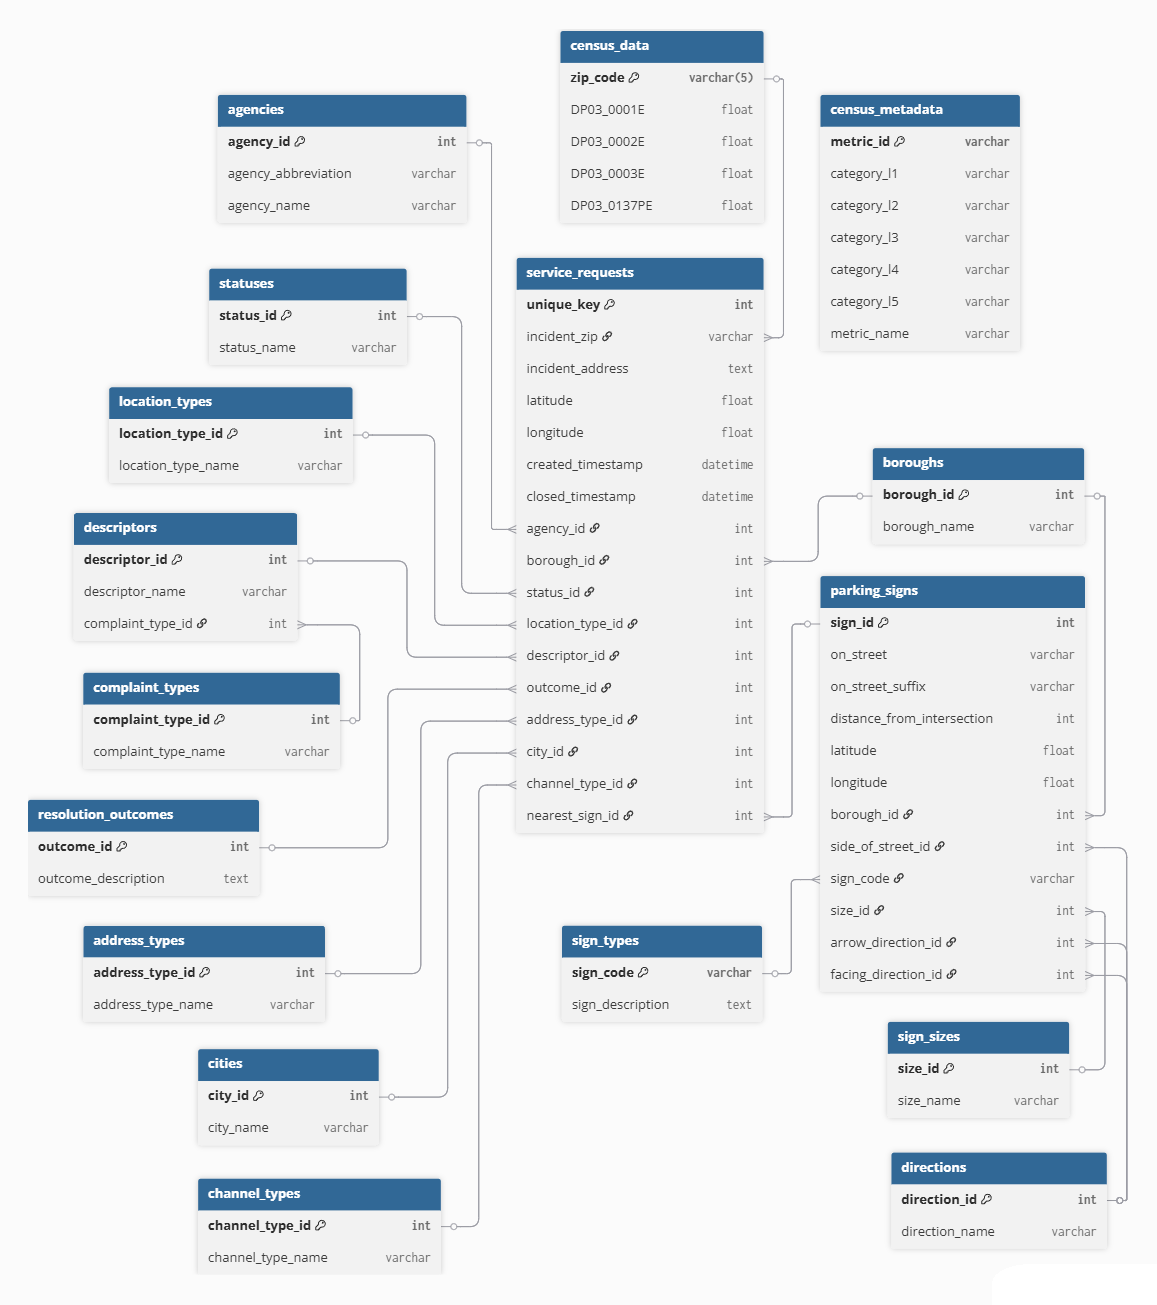
LOAD Phase
Create Database Tables
Here is the complete dictionary of all SQL CREATE TABLE commands.
Key= name of table,Value= create table command string
Run command CREATE TABLE for all keys in the dictionary:
for key, value in create_table_dictionary.items():
  my_drop_table(key)
  run_command(value)
print(f"Created Table: {key}")Created Table: agencies
Created Table: boroughs
Created Table: statuses
Created Table: location_types
Created Table: complaint_types
Created Table: descriptors
Created Table: resolution_outcomes
Created Table: address_types
Created Table: cities
Created Table: channel_types
Created Table: directions
Created Table: sign_types
Created Table: sign_sizes
Created Table: census_metadata
Created Table: parking_signs
Created Table: census_data
Created Table: service_requests
Show the names of all tables in the database:
get_table_names()[('census_metadata',),
('agencies',),
('address_types',),
('cities',),
('parking_signs',),
('boroughs',),
('statuses',),
('directions',),
('census_data',),
('location_types',),
('complaint_types',),
('sign_types',),
('service_requests',),
('channel_types',),
('descriptors',),
('sign_sizes',),
('resolution_outcomes',)]
Insert Data Into Tables
Insert data for all lookup tables first:
insert_df_to_db(agencies_df, 'agencies')
insert_df_to_db(boroughs_df, 'boroughs')
insert_df_to_db(statuses_df, 'statuses')
insert_df_to_db(location_types_df, 'location_types')
insert_df_to_db(complaint_types_df, 'complaint_types')
insert_df_to_db(descriptors_df, 'descriptors')
insert_df_to_db(resolution_outcomes_df, 'resolution_outcomes')
insert_df_to_db(address_types_df, 'address_types')
insert_df_to_db(cities_df, 'cities')
insert_df_to_db(channel_types_df, 'channel_types')
insert_df_to_db(directions_df, 'directions')
insert_df_to_db(sign_types_df, 'sign_types')
insert_df_to_db(sign_sizes_df, 'sign_sizes')
insert_df_to_db(census_metadata_df, 'census_metadata')Inserted 1 rows into 'agencies'.
Inserted 5 rows into 'boroughs'.
Inserted 2 rows into 'statuses'.
Inserted 22 rows into 'location_types'.
Inserted 23 rows into 'complaint_types'.
Inserted 69 rows into 'descriptors'.
Inserted 16 rows into 'resolution_outcomes'.
Inserted 6 rows into 'address_types'.
Inserted 50 rows into 'cities'.
Inserted 5 rows into 'channel_types'.
Inserted 10 rows into 'directions'.
Inserted 3762 rows into 'sign_types'.
Inserted 81 rows into 'sign_sizes'.
Inserted 274 rows into 'census_metadata'.
Now the main data tables:
insert_df_to_db(census_df, 'census_data')
insert_df_to_db(parking_df, 'parking_signs')
insert_df_to_db(nyc_311_df_filtered, 'service_requests')Inserted 1824 rows into 'census_data'.
Inserted 404140 rows into 'parking_signs'.
Inserted 1379596 rows into 'service_requests'.
Load phase complete. Now we can query the finished database!
SQL Commands / Queries (Using the Database)
Check total row counts to verify insertion of main tables:
print(run_query("SELECT COUNT(*) FROM service_requests;"))
print(run_query("SELECT COUNT(*) FROM parking_signs;"))
print(run_query("SELECT COUNT(*) FROM census_data;"))(['count'], [(1379596,)])
(['count'], [(404140,)])
(['count'], [(1824,)])
What are the top 5 zip codes with the most service requests?
colnames_1, data_1 = run_query(
  """
  SELECT
      incident_zip,
      COUNT(*) AS request_count
  FROM
      service_requests
  GROUP BY
      incident_zip
  ORDER BY
      request_count DESC
  LIMIT 5;
  """
  )

print('Top 5 zip codes with the most service requests')
top_zips_df = pd.DataFrame(data_1, columns=colnames_1)
display(top_zips_df)Top 5 zip codes with the most service requests
| incident_zip | request_count |
|---|---|
| 11201 | 24851 |
| 11385 | 24316 |
| 11368 | 19684 |
| 10468 | 19329 |
| 10467 | 17971 |
Are noise complaints more common in lower or higher-income zip codes?
# Query
colnames_2, data_2 = run_query(
  """
  WITH complaint_info AS (
      SELECT
          d.descriptor_id,
          ct.complaint_type_name
      FROM
          descriptors d
      JOIN
          complaint_types ct ON d.complaint_type_id = ct.complaint_type_id
  )
  SELECT
      sr.incident_zip,
      cd.dp03_0062e AS median_household_income,
      COUNT(sr.unique_key) AS number_of_noise_complaints
  FROM
      service_requests sr
  JOIN
      census_data cd ON sr.incident_zip = cd.zip_code
  JOIN
      complaint_info ci ON sr.descriptor_id = ci.descriptor_id
  WHERE
      ci.complaint_type_name LIKE 'Noise%%'
      AND cd.dp03_0062e IS NOT NULL
      AND cd.dp03_0062e > 0
  GROUP BY
      sr.incident_zip,
      cd.dp03_0062e
  HAVING
      COUNT(sr.unique_key) > 10
  """
  )

# Create DataFrame
noise_df = pd.DataFrame(data_2, columns=colnames_2)

noise_df['median_household_income'] = noise_df['median_household_income'].astype(float)
noise_df['number_of_noise_complaints'] = noise_df['number_of_noise_complaints'].astype(float)

# Generate Statistics
correlation, p_value = stats.pearsonr(noise_df['median_household_income'], noise_df['number_of_noise_complaints'])
print(f"Pearson Correlation Coefficient: {correlation:.4f}")
print(f"P-value: {p_value:.4e}")

# Generate Scatterplot
plt.figure(figsize=(12, 8))
sns.regplot(data=noise_df, x='median_household_income', y='number_of_noise_complaints',
            scatter_kws={'alpha':0.6, 'color': '#007ACC'}, line_kws={'color':'#E3120B'})

plt.text(0.65, 0.95, f'Pearson r = {correlation:.2f}\np-value = {p_value:.4f}',
         transform=plt.gca().transAxes, fontsize=12,
         verticalalignment='top', bbox=dict(boxstyle='round,pad=0.5', fc='wheat', alpha=0.7))

plt.title('Noise Complaints vs. Median Household Income by NYC Zip Code', fontsize=16)
plt.xlabel('Median Household Income ($)', fontsize=12)
plt.ylabel('Number of Noise Complaints', fontsize=12)
plt.grid(True, which='both', linestyle='--', linewidth=0.5)

formatter = mticker.FormatStrFormatter('$%1.0f')
plt.gca().get_xaxis().set_major_formatter(formatter)

plt.savefig('noise_complaints_vs_income.png')
plt.show()Statistics
Pearson Correlation Coefficient (r): -0.4648
P-value: 5.5801e-11
Scatter Plot
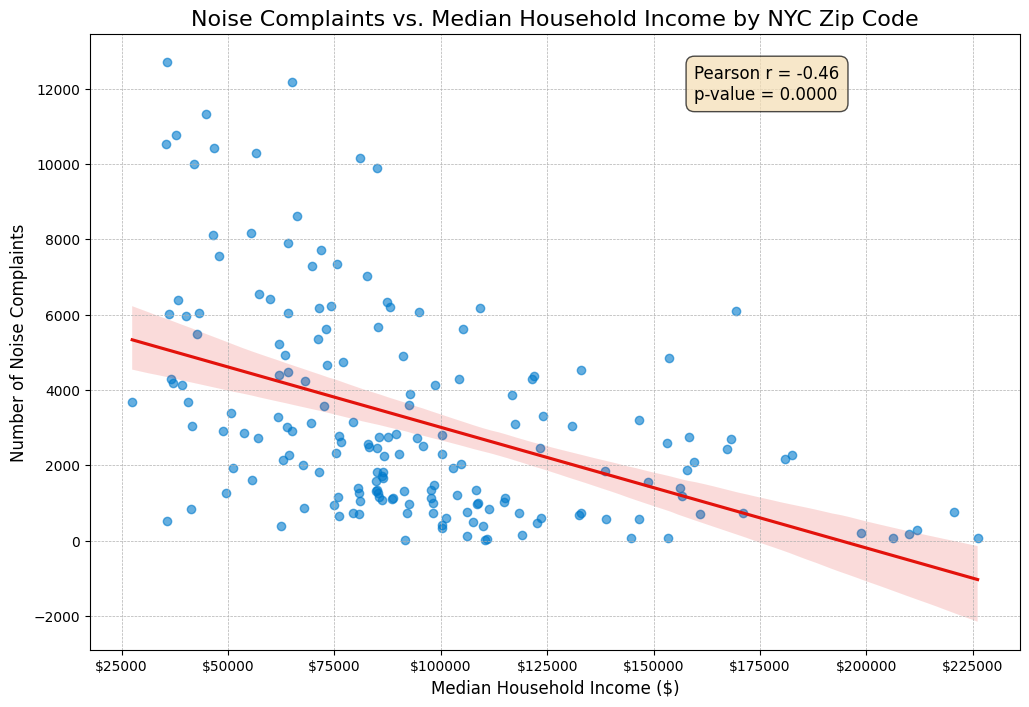
Results / Conclusions
The r-value of −0.46 indicates a moderate negative correlation (expressed in the downward slope), and the extremely low p-value (almost zero) tells us that this result is highly statistically significant.
The data strongly suggests that wealthier NYC zip codes report fewer noise complaints than less affluent ones.
What is the most common type of parking sign near illegal parking complaints?
# Query
colnames_3, data_3 = run_query(
  """
  WITH complaint_info AS (
      SELECT
          d.descriptor_id,
          ct.complaint_type_name
      FROM
          descriptors d
      JOIN
          complaint_types ct ON d.complaint_type_id = ct.complaint_type_id
  )
  SELECT
      st.sign_description,
      COUNT(sr.unique_key) AS complaint_count
  FROM
      service_requests sr
  JOIN
      complaint_info ci ON sr.descriptor_id = ci.descriptor_id
  JOIN
      parking_signs ps ON sr.nearest_sign_id = ps.sign_id
  JOIN
      sign_types st ON ps.sign_code = st.sign_code
  WHERE
      ci.complaint_type_name = 'Illegal Parking'
  GROUP BY
      st.sign_description
  ORDER BY
      complaint_count DESC
  LIMIT 10;
  """
  )

# Results
print('What is the most common type of parking sign near illegal parking complaints?')
common_sign_df = pd.DataFrame(data_3, columns=colnames_3)
display(common_sign_df)What is the most common type of parking sign near illegal parking complaints?
| sign_description | complaint_count |
|---|---|
| NO STANDING ANYTIME –> (SUPERSEDES SP-1044BA,… | 48970 |
| NO STANDING ANYTIME <-> (SUPERSEDES SP-1044B, … | 25320 |
| NO PARKING ANYTIME –> (SUPERSEDES SP-854CA) | 12207 |
| NO PARKING (SANITATION BROOM SYMBOL) MONDAY TH… | 11805 |
| NO PARKING (SANITATION BROOM SYMBOL) TUESDAY 9… | 11308 |
| PAY-BY-CELL LOCATOR NUMBER | 11074 |
| NO PARKING ANYTIME <-> (SUPERSEDES SP-854C) | 10532 |
| NO PARKING (SANITATION BROOM SYMBOL) TUESDAY F… | 10489 |
| NO PARKING (SANITATION BROOM SYMBOL) THURSDAY … | 9615 |
| NO PARKING (SANITATION BROOM SYMBOL) FRIDAY 11… | 9310 |
Conclusions
- “No Standing” Zones are the biggest problem
- By far the largest number of complaints (~74,400 total). You can’t park, wait for a passenger, load or unload in these areas. This suggests that areas with a high need for traffic flow (like bus lanes or busy commercial streets where these signs are common) are hotspots for illegal parking complaints, because people also have a need to park there.
- Driver non-compliance likely the biggest factor
- Most of the violations are not of the complex, specific days or times signage, but the unambiguous “ANYTIME” ones.
- Street cleaners
- A large number of complaints likely due to people failing to move their cars on those specific days or times.
- Future Work
- This data inspires more analysis, like mapping hotspots, or determining if the complaints near the street cleaning signs spike on the times indicated on them.
Is there a correlation between socioeconomic status of a NYC zip code and the time it takes to resolve 311 service requests?
# Query
colnames_4, data_4 = run_query(
  """
  SELECT
      sr.incident_zip,
      AVG(EXTRACT(EPOCH FROM (sr.closed_timestamp - sr.created_timestamp))) / 3600 AS avg_resolution_hours,
      cd.dp03_0062e AS median_household_income
  FROM
      service_requests sr
  JOIN
      census_data cd ON sr.incident_zip = cd.zip_code
  WHERE
      cd.dp03_0062e IS NOT NULL
      AND cd.dp03_0062e > 0
      AND sr.closed_timestamp > sr.created_timestamp
  GROUP BY
      sr.incident_zip,
      cd.dp03_0062e
  HAVING
      COUNT(sr.unique_key) > 100;
  """
  )

# Create DataFrame
ses_df = pd.DataFrame(data_4, columns=colnames_4)

ses_df['median_household_income'] = ses_df['median_household_income'].astype(float)
ses_df['avg_resolution_hours'] = ses_df['avg_resolution_hours'].astype(float)

# Generate Statistics
correlation, p_value = stats.pearsonr(ses_df['median_household_income'], ses_df['avg_resolution_hours'])
print(f"Pearson Correlation Coefficient: {correlation:.4f}")
print(f"P-value: {p_value:.4e}")

# Generate Scatterplot
plt.figure(figsize=(12, 8))
sns.regplot(data=ses_df, x='median_household_income', y='avg_resolution_hours',
            scatter_kws={'alpha':0.5, 'color': '#007ACC'}, line_kws={'color':'#E3120B'})

plt.title('Socioeconomic Status vs. 311 Resolution Time by NYC Zip Code', fontsize=16)
plt.xlabel('Median Household Income ($)', fontsize=12)
plt.ylabel('Average Resolution Time (Hours)', fontsize=12)
plt.grid(True, which='both', linestyle='--', linewidth=0.5)

plt.ticklabel_format(style='plain', axis='x')
plt.gca().get_xaxis().set_major_formatter(plt.FuncFormatter(lambda x, p: format(int(x), ',')))

plt.text(0.05, 0.95, f'Pearson r = {correlation:.2f}\np-value = {p_value:.4f}',
         transform=plt.gca().transAxes, fontsize=12,
         verticalalignment='top', bbox=dict(boxstyle='round,pad=0.5', fc='wheat', alpha=0.5))

plt.savefig('ses_vs_resolution_time.png')
plt.show()Statistics
Pearson Correlation Coefficient (r): -0.2786
P-value: 1.6571e-04
Scatter Plot
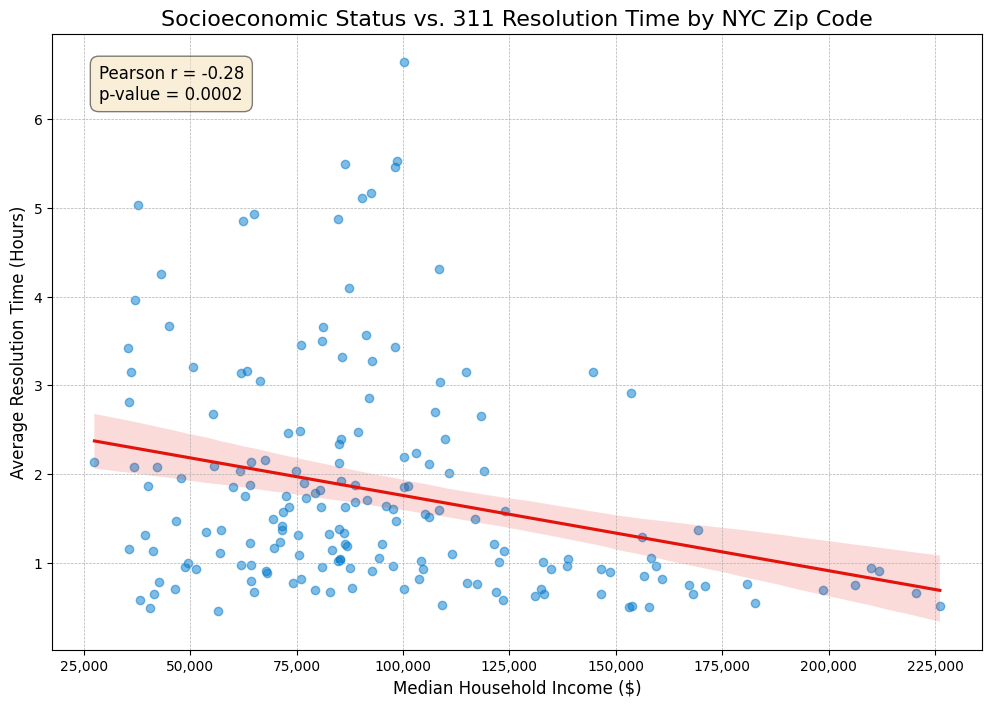
Results / Conclusions
The r-value of −0.28 indicates a weak negative correlation, and the very low p-value (p < 0.001) tells us that this result is highly statistically significant.
The data strongly suggests that as the median household income in a zip code increases, the average time to resolve a 311 request tends to decrease.
CONCLUSION
We have successfully built a query-ready database that integrates civic service data with parking regulations and socioeconomic indicators, enabling complex analytical questions that leverage the multiple connected data sources.
We have only scratched the surface of the possible queries.
Reference: Final Data Dictionary
nyc_311_df_filtered
| Column | Non-Null Count | Dtype |
|---|---|---|
| unique_key | 1379596 | int64 |
| incident_zip | 1379596 | object |
| incident_address | 1379596 | object |
| latitude | 1379596 | float64 |
| longitude | 1379596 | float64 |
| created_timestamp | 1379596 | datetime64[ns] |
| closed_timestamp | 1379596 | datetime64[ns] |
| agency_id | 1379596 | int64 |
| borough_id | 1379596 | int64 |
| status_id | 1379596 | int64 |
| location_type_id | 1379596 | int64 |
| descriptor_id | 1379596 | int64 |
| outcome_id | 1379596 | int64 |
| address_type_id | 1379596 | int64 |
| city_id | 1379596 | int64 |
| channel_type_id | 1379596 | int64 |
| nearest_sign_id | 1379596 | int64 |
agencies_df
| Column | Non-Null Count | Dtype |
|---|---|---|
| agency_abbreviation | 1 | object |
| agency_name | 1 | object |
| agency_id | 1 | int64 |
boroughs_df
| Column | Non-Null Count | Dtype |
|---|---|---|
| borough_id | 5 | int64 |
| borough_name | 5 | object |
statuses_df
| Column | Non-Null Count | Dtype |
|---|---|---|
| status_name | 2 | object |
| status_id | 2 | int64 |
location_types_df
| Column | Non-Null Count | Dtype |
|---|---|---|
| location_type_name | 22 | object |
| location_type_id | 22 | int64 |
complaint_types_df
| Column | Non-Null Count | Dtype |
|---|---|---|
| complaint_type_name | 23 | object |
| complaint_type_id | 23 | int64 |
descriptors_df
| Column | Non-Null Count | Dtype |
|---|---|---|
| descriptor_id | 69 | int64 |
| descriptor_name | 69 | object |
| complaint_type_id | 69 | int64 |
resolution_outcomes_df
| Column | Non-Null Count | Dtype |
|---|---|---|
| outcome_description | 16 | object |
| outcome_id | 16 | int64 |
address_types_df
| Column | Non-Null Count | Dtype |
|---|---|---|
| address_type_name | 6 | object |
| address_type_id | 6 | int64 |
cities_df
| Column | Non-Null Count | Dtype |
|---|---|---|
| city_name | 50 | object |
| city_id | 50 | int64 |
channel_types_df
| Column | Non-Null Count | Dtype |
|---|---|---|
| channel_type_name | 5 | object |
| channel_type_id | 5 | int64 |
parking_df
| Column | Non-Null Count | Dtype |
|---|---|---|
| on_street | 404140 | object |
| on_street_suffix | 9116 | object |
| sign_code | 404140 | object |
| distance_from_intersection | 404140 | int64 |
| latitude | 404140 | float64 |
| longitude | 404140 | float64 |
| borough_id | 404140 | int64 |
| side_of_street_id | 404140 | int64 |
| size_id | 404140 | int64 |
| arrow_direction_id | 97358 | Int64 |
| facing_direction_id | 1329 | Int64 |
| sign_id | 404140 | int64 |
sign_types_df
| Column | Non-Null Count | Dtype |
|---|---|---|
| sign_code | 3762 | object |
| sign_description | 3762 | object |
sign_sizes_df
| Column | Non-Null Count | Dtype |
|---|---|---|
| size_name | 81 | object |
| size_id | 81 | int64 |
directions_df
| Column | Non-Null Count | Dtype |
|---|---|---|
| direction_name | 10 | object |
| direction_id | 10 | int64 |
census_df
| RangeIndex: | 1824 entries, 0 to 1823 |
| Columns: | 274 entries, DP03_0001E to DP03_0137PE |
| dtypes: | float64(154), int64(120) |
census_metadata_df
| Column | Non-Null Count | Dtype |
|---|---|---|
| metric_id | 274 | object |
| category_l1 | 18 | object |
| category_l2 | 52 | object |
| category_l3 | 100 | object |
| category_l4 | 236 | object |
| category_l5 | 274 | object |
| metric_name | 274 | object |